Last update: October 14, 2025
This page contains information about some of the data available in the FEWS NET Data Explorer (FDE) for Chad (Tchad). This is not a comprehensive guide.
For information about using the filters and fields for specific domains in the FDE, see Choose a Data Domain.
Summary table
|
ISO 3166-1 codes |
Alpha 2: TD, Alpha 3: TCD, Numeric: 148 |
|---|---|
|
Administrative units |
Admin 1 = Province, Admin 2 = Department, Admin 3 = Sub-prefecture |
|
Agricultural seasons |
Main season, winter off-season |
|
Major crops |
Sorghum, millet, berbéré, cotton |
Country food security context
Statistical reporting units
Chad (Tchad) usually uses administrative units as their statistical reporting units.
Administrative (admin) units are the geographical areas into which a country is divided. FEWS NET uses the following terminology: National boundary = admin 0, First sub-national division = admin 1 (e.g., states in the United States), Second sub-national division = admin 2 (e.g., counties in the United States), and so on.
Admin 1: Province, of which there are currently 23.
Admin 2: Department/Département, 120 in number.
Admin 3: Sub-Prefecture/Sous-préfecture, 454 in number.
Evolution of Administrative and Crop Statistic Reporting Units
-
1960: Immediately after independence Chad’s administrative Regions became Prefectures and Districts became Sub-prefectures. The number of Prefectures rose from 11 to 14.
-
1999 - 2002: There was a large increase in the number of Prefectures and they became Departments, before being changed back into Regions. Regions were then divided into Departments and Departments were divided into Sub-prefectures.
-
2008: The number of Regions increased to 22.
-
2012: Ennedi Region was split into Ennedi-Est and Ennedi-Ouest, producing 23 regions.
-
2018: Regions became Provinces, Departments were not changed, and Communes became Sub-Prefectures.
-
2024: The most recent administrative reform saw an increase in the number of Departments (a total of 120) and Sub-prefectures (454).
Table 1: Evolution of Admin 1 Administrative Units (1960-present)
|
# |
1960 |
1999 |
2002 |
2008 |
2012 |
|---|---|---|---|---|---|
|
|
Prefecture |
Department then Region |
Region |
Region |
Region then Province* |
|
1 |
Borkou-Ennedi- Tibesti (B.E.T.) |
Borkou |
B.E.T. |
Borkou |
Borkou |
|
2 |
B.E.T. |
Ennedi |
B.E.T. |
Ennedi |
Ennedi-Est |
|
3 |
B.E.T. |
Ennedi |
B.E.T. |
Ennedi |
Ennedi-Ouest |
|
4 |
B.E.T. |
Tibesti |
B.E.T. |
Tibesti |
Tibesti |
|
5 |
Batha |
Batha Ouest |
Batha |
Batha |
Batha |
|
6 |
Batha |
Batha Est |
Merge w/Batha |
|
|
|
7 |
Biltine |
Biltine |
Wadi Fira |
Wadi Fira |
Wadi Fira |
|
8 |
Tandjile |
Tandjile Est |
Tandjile |
Tandjile |
Tandjile |
|
9 |
Tandjile |
Tandjile Ouest |
Merge w/Tandjile |
|
|
|
10 |
Ouaddai |
Ouaddai |
Ouaddai |
Ouaddai |
Ouaddai |
|
11 |
Ouaddai |
Sila |
Merge w/Ouaddai |
Sila |
Sila |
|
12 |
Ouaddai |
Assongha |
Merge w/Ouaddai |
|
|
|
13 |
Kanem |
Kanem |
Kanem |
Kanem |
Kanem |
|
14 |
Kanem |
Bahr el-Gazel |
Merge w/Kanem |
Barh el-Gazel |
Barh el-Gazel |
|
15 |
Lac |
Lac |
Lac |
Lac |
Lac |
|
16 |
Logone Occidental |
Logone Occidental |
Logone Occidental |
Logone Occidental |
Logone Occidental |
|
17 |
Logone Oriental |
Logone Oriental |
Logone Oriental |
Logone Oriental |
Logone Oriental |
|
18 |
Logone Oriental |
Monts de Lam |
Merge w/Logone Oriental |
|
|
|
19 |
Guera |
Guera |
Guera |
Guera |
Guera |
|
20 |
Chari-Baguirmi |
Baguirmi |
Chari-Baguirmi |
Chari-Baguirmi |
Chari-Baguirmi |
|
21 |
Chari-Baguirmi |
Baguirmi |
N'Djamena |
N'Djamena |
N'Djamena |
|
22 |
Chari-Baguirmi |
Hadjer-Lamis |
Hadjer-Lamis |
Hadjer-Lamis |
Hadjer-Lamis |
|
23 |
Chari-Baguirmi |
Dababa |
Merge w/Hadjer-Lamis |
|
|
|
24 |
Mayo-Kebbi |
Mayo-Dala |
Mayo-Kebbi Ouest |
Mayo-Kebbi Ouest |
Mayo-Kebbi Ouest |
|
25 |
Mayo-Kebbi |
Mayo-Boneye |
Mayo-Kebbi Est |
Mayo-Kebbi Est |
Mayo-Kebbi Est |
|
26 |
Mayo-Kebbi |
Kabbia |
Mayo-Kebbi Est |
|
|
|
27 |
Moyen-Chari |
Lac Iro |
Moyen-Chari |
Moyen-Chari |
Moyen-Chari |
|
28 |
Moyen-Chari |
Bahr Koh |
Merge w/Moyen-Chari |
|
|
|
29 |
Moyen-Chari |
Mandoul |
Mandoul |
Mandoul |
Mandoul |
|
30 |
Salamat |
Salamat |
Salamat |
Salamat |
Salamat |
|
# |
14 |
28 |
18 |
22 |
23 |
* In 2018, Admin 1 Regions became Provinces.
Crop data
Explore our crop data.
View our documentation on using the Crop Domain.
Since its independence in 1960, Chad has experienced long periods of internal social and political strife and warfare in which external nations have participated. This, and Chad’s relative extreme poverty in a global sense, has contributed to a record of annual agricultural production filled with gaps and partial spatial coverage. More recently, revenues from oil and minerals have provided more resources to document the country’s agricultural performance, but current crop statistics are still not easy to acquire.
The northern third of Chad lies in the Saharan Desert and, with the exception of small irrigated gardens around oases and date production, the area is not agriculturally productive.
The central Sahelian zone sees an average annual rainfall of 350 - 800 millimeters. The minimum rainfall needed for the hardiest of Chad's varieties of sorghum, called berbéré, is 350 millimeters. Other varieties of sorghum and millet, along with peanuts and dry beans, are grown where there is more rainfall or surface and ground reservoirs of water, many of a temporary nature. Crop yields are far lower than they are in the south or near rivers and lakes. Farmers in the Sahelian zone take every advantage of the seasonal filling and drying of lakes, streambeds, and low-lying depressions to grow recession crops as the waters dry away, a practice particularly popular around Lake Fitri.
The Sudanian zone in the southern part of the country comprises those areas with an average annual rainfall of 800 millimeters or more. This region, which accounts for about 10 percent of the total land area, contains the nation's most fertile croplands. Settled agricultural communities growing a wide variety of food crops are its main profile. More than 50% of all land under cultivation in Chad is in the Sudanian region.
Note that no authoritative crop statistics for cotton, Chad’s former principal export commodity grown exclusively in a few provinces in the Sudanian zone, have been located, and the crop is not found in the FDW for that reason.
Crop estimate data sources
The only relatively operational source of crop statistics in Chad today is an online data portal managed by a commercial entity, reached via the country’s Institut National de la Statistique, des Études Économiques et Démographiques (INSEED) website. INSEED is an entity of the Ministère des Finances, du Budget, de l'Économie, du Plan et de la Coopération Internationale.
From the INSEED main screen, select Bases de données → Open Data Portal (ODP) to open the Chad Data Portal. From there, select Data Catalog → Agriculture, to export the country’s archive1 of crop statistics for the 2010-2023 period.
Other crop statistics data from the same general period were previously available from annual joint crop assessment missions reporting, authored by a joint team of observers from the United Nations Food and Agriculture Organization (FAO) and World Food Program (WFP), the Comité permanent inter-état de lutte contre la sécheresse au Sahel (CILSS), the Commission Européenne, FEWS NET, and the Government of Chad.
Crop statistics from the 1983-2009 period were sourced from:
-
Periodic annual crop survey documents produced by the Chadian Office National de Développement Rural (ONDR), the Ministry of Agriculture, and/or the Société de Développement du Lac (SODELAC)
-
An earlier FEWS NET crop statistics gathering initiative called FEWS NET Agro-Maps.
Crop reporting units
In Chad, crop statistics have been reported by administrative units, specifically provinces.
Year and season definition
Year definition
In a pattern that is similar to other Sahelian countries to its West, Chad associates its crop production and crop statistics with the Gregorian calendar year in which it is planted. It often identifies this year with a single-year format (e.g. 2024). When a two-year format is used (e.g. 2024/2025), it is referring to crop production that mostly occurs in 2024, but does also include the cold off-season planting and harvest cycle that extends into the first few months of the following year.
Example: 2016 refers to May 1, 2016 - April 30, 2017
Seasons
The country extends north and south into three very different agro-ecological zones with differing climatic and cropping profiles. The season start and end dates in the following table are strongly influenced by location on this north-south gradient.
Table 2: Seasonal definitions
|
Season |
Start date |
End date |
|---|---|---|
|
Cropping year |
1-May |
30-April |
|
Main season |
1-May |
31-Oct |
|
Cold off-season |
1-Nov |
28-Feb |
The primary cropping cycle in Chad’s Sudanian and Sahelian regions is based on its single main rainy season and, importantly, on late-planted, cold off-season, flood recession crops like berbéré and rice. These crops are able to take advantage of the progressive drying of seasonal water sources since they can be planted and grown in a still moist soil.
What is berbéré?
One of the most important food and forage crops grown in Chad is called berbéré, and it is often referred to as either a millet or a sorghum. Often, in both public media and even scientific literature, sorghum itself is identified as one of many species of millets. All of these are grasses but sorghum is one species of grass, Sorghum bi-color, and there are many species of millets.
Berbéré, a large and important food and forage crop grown in Chad, is one of many varieties2 of sorghum found in the world, most often identified by their color: red, orange, bronze, white, tan and black. All are known for their ability to grow in relatively dry conditions, and for their use as both a food and forage crop for animals. Berbéré in Chad has a cream or relatively white color, and is one of the most tolerant varieties of dry growing conditions.
A notable issue in many existing national-level crop statistics databases (e.g. FAOStat) is that berbéré is often not coded as sorghum and is instead considered an other grain, a grain not elsewhere counted (N.E.C.), or not even considered in balance sheet calculations including sorghum.
In the FEWS NET crop database berbéré is coded as a white sorghum with the code R01142AT.
The principal farming activities typically follow this schedule:
-
March and April: Fields are prepared before the first rains arrive.
-
May through October: Planting, sometimes more than once, is then followed by intensive weeding during the main rains.
-
September through December: Millet, sorghum, and other crops are harvested.
-
Late harvest: Flood-recession crops like berbéré and rice are harvested as late as February in the following year.
Crop Calendar
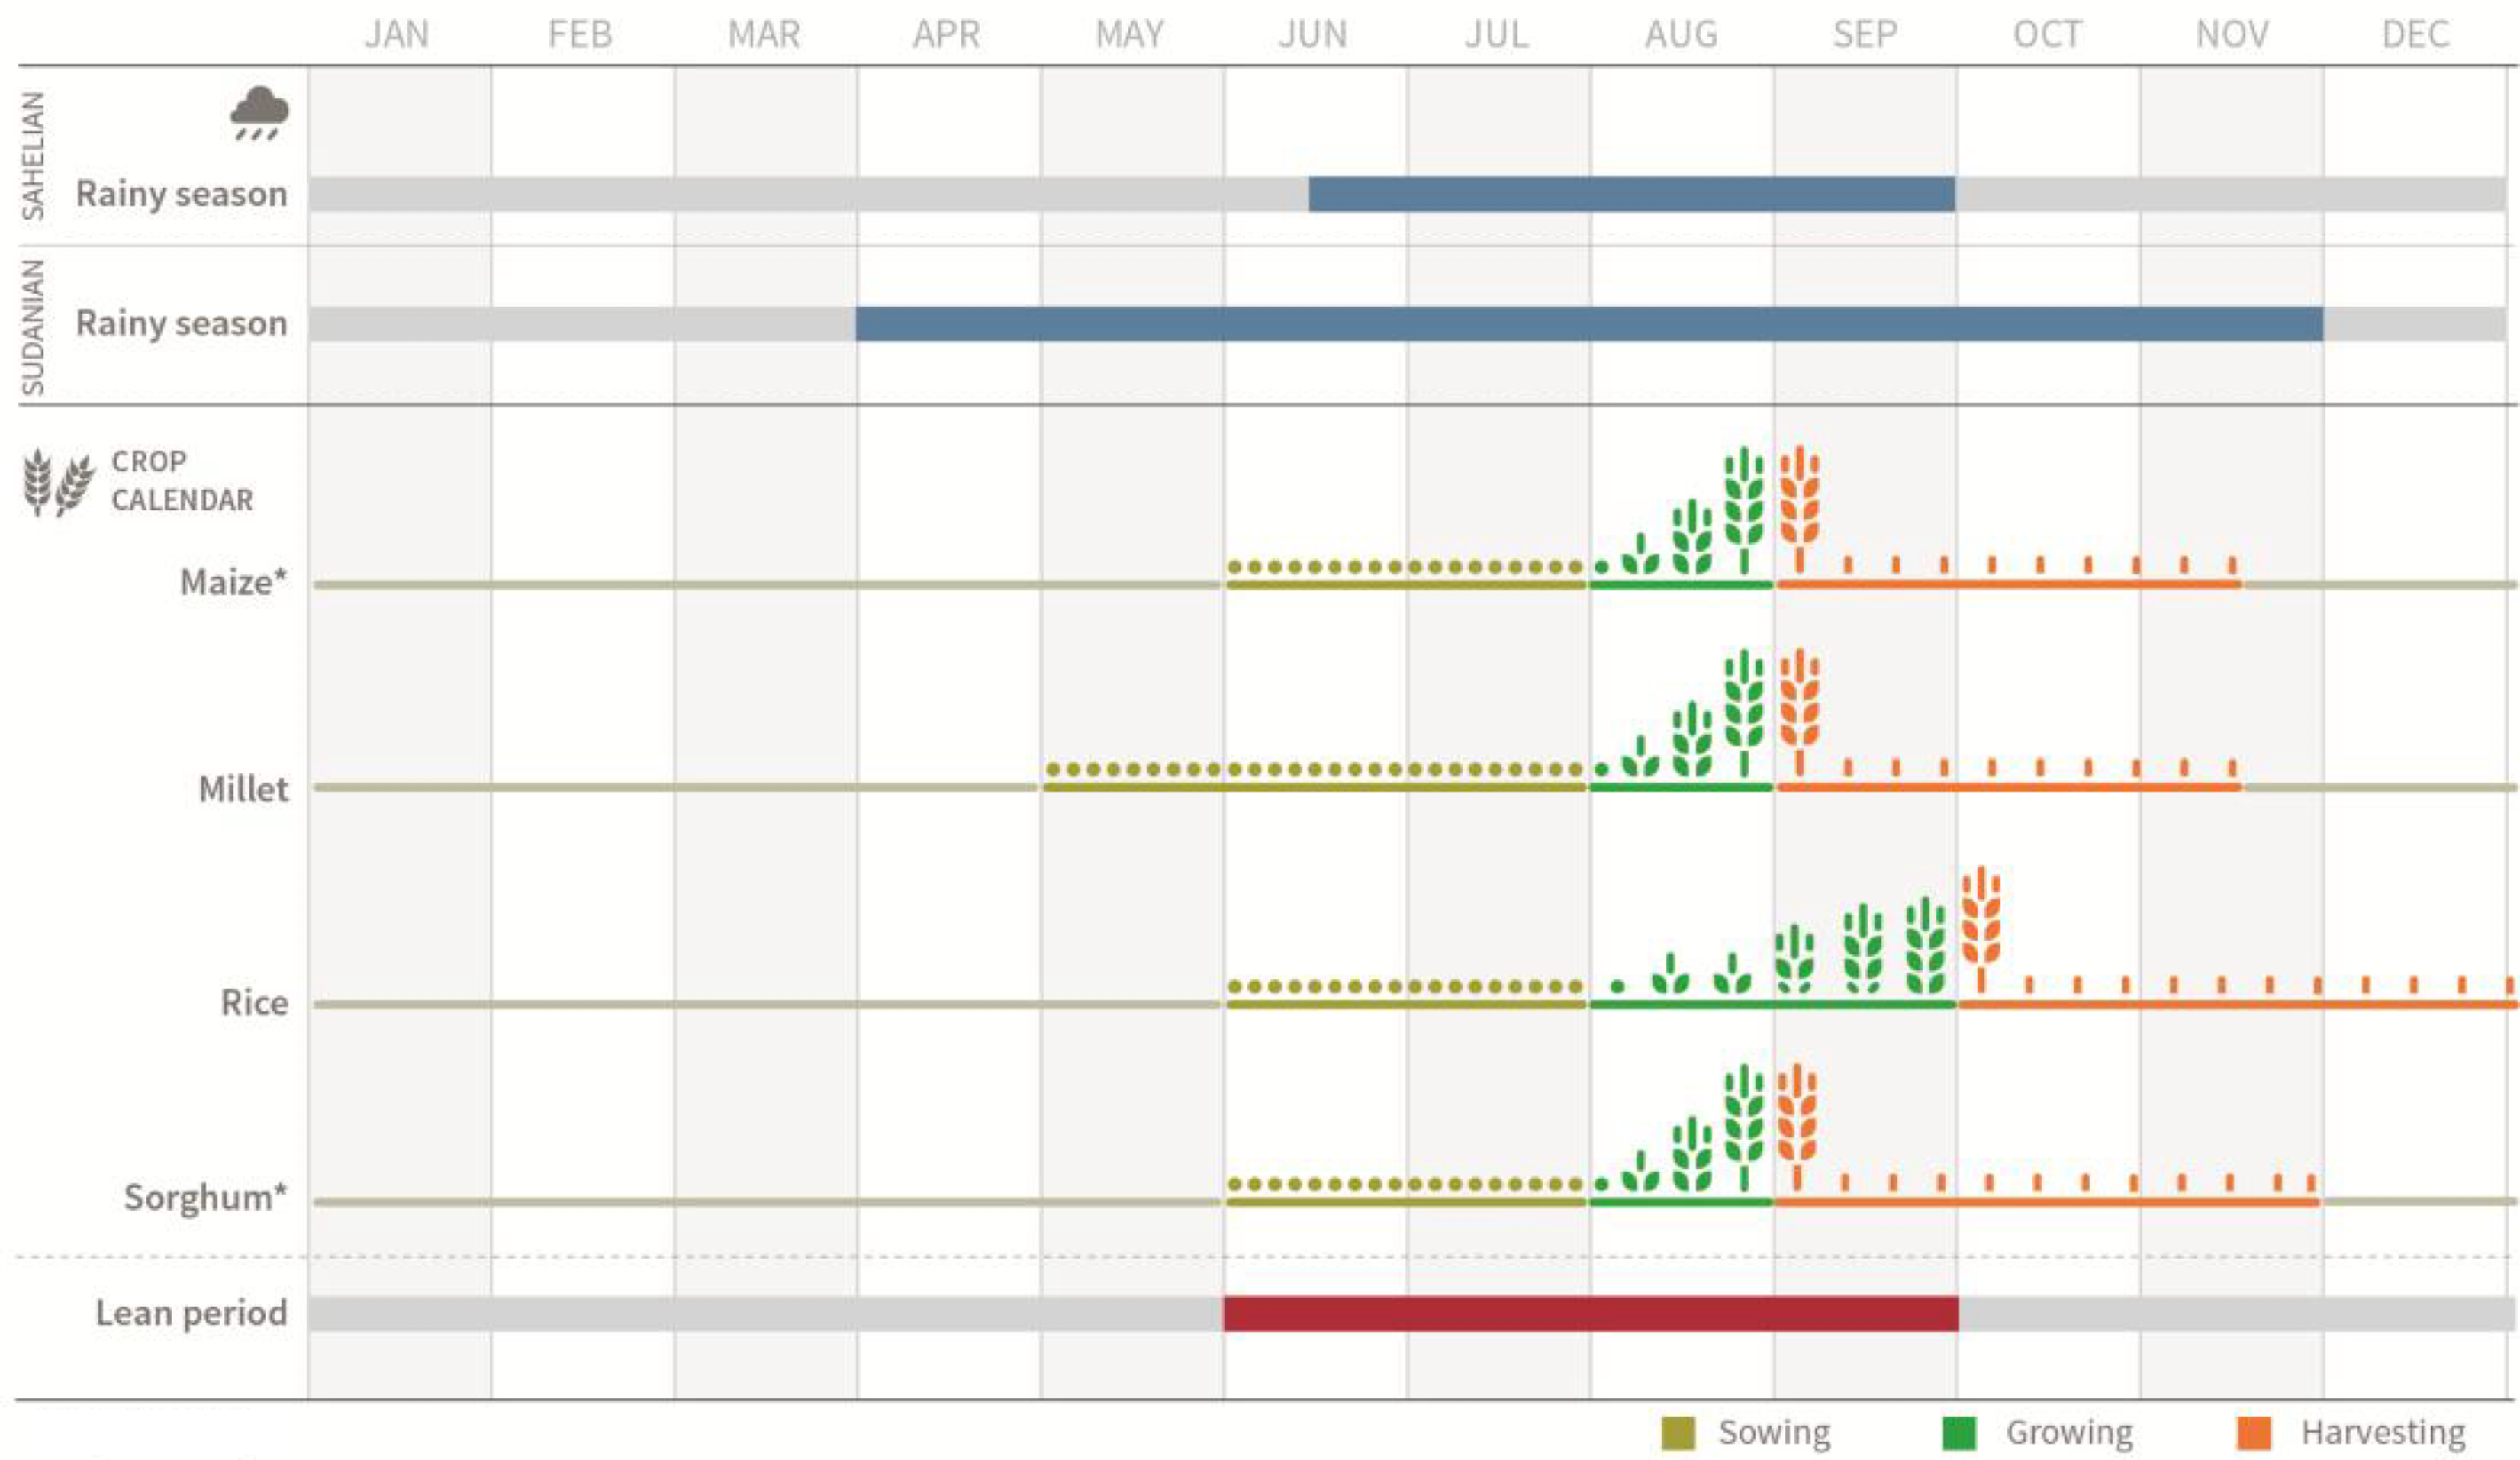
Primary crops
Chad's most important subsistence crops have been sorghum, (37% of total cereal production, 2020-2023), millet (26%), berbéré (21%) and maize (15%). Its most important commercial crop has been cotton.
Historical trends
Areas under production for these grains showed a downward trend after the mid-1950s, dropping from an average of 15,000 square kilometres to around 10,000 square kilometres in the 1960s and 1970s and falling to levels averaging 7,500 square kilometres between 1981 and 1986. Taking an average for all lands devoted to grain production from 1981 - 1985, sorghum and millet cultivation accounted for 85% of the total area, according to the Food and Agriculture Organization (FAO). Between 1980 and 1985, these coarse grains accounted for 80 to 95% of all grain production.
Peanuts have become an important food crop in Chad. They are eaten roasted or dry, and their oil is used in cooking. Peanuts are cultivated in both the Sudanian and Sahelian zones. Production of peanuts has been more stable than that of any other major crop, staying in the 90,000- to 100,000-ton range from the 1950s through 1987, with dips in drought years. The area under peanut production has also remained stable, although kilograms-per-hectare yields declined slightly.
The importance of tubers has grown dramatically over the years. Cassava and yams were the most important crops in this category, with much smaller production of potatoes, sweet potatoes, and cocoyams (taro). Grown only in the East Sudanian savannas, tubers were once neglected, although such cultivation is widespread in other parts of subtropical West Africa. Estimates in the 1950s put tuber production at 50,000 tons annually. By 1961 it exceeded 200,000 tons. From 1961 - 1984, the proportion of roots and tubers in the national diet rose from 6 to 17%. The reason for this important shift in eating habits among people of the East Sudanian savannas was the hedge these crops provided against famine in years when drought reduced millet and sorghum production.
The Chadian crops for which statistics are available in the FEWS NET Data Warehouse include those in the following table:
Table 3: Chadian crops present in the FEWS NET crop database
|
FEWS Crop Code |
Crop name (EN) |
Crop name (FR) |
|
R01112AA |
Wheat |
Blé |
|
R01122AA |
Maize |
Maïs |
|
R01132AA |
Rice, paddy |
Riz |
|
R01142AA |
Sorghum |
Sorgho |
|
R01142AT |
Berbéré |
Berbéré, Sorgho blanc |
|
R01182AD |
Millet |
Mil pénicillaire |
|
R01190AB |
Fonio |
Fonio |
|
R01422AA |
Groundnuts |
Arachide |
|
R01423AA |
Bambara groundnut |
Pois de terre |
|
R01444AA |
Sesame seed |
Sésame |
|
R01591AA |
Sweet Potato |
Patate douce |
|
R01592AA |
Cassava |
Manioc |
|
R01594AA |
Taro |
Taro |
|
R01706AA |
Cowpeas |
Niébé |
Production systems
Chadian crop statistics carry no additional crop production system (e.g. rainfed, irrigated, etc.) information. There are nevertheless strong differences between the farming practices of the three agro-ecological zones.
-
Saharan zone: Not an area of significant crop production, except for some dates and vegetables and legumes grown in the scattered oases.
-
Sahelian zone: Crop rotation in the Sahelian zone traditionally begins with sorghum or millet. Mixed crops of sorghum and/or millet, with peanuts, legumes, or tubers, are then cultivated for approximately three years. Farmers then return the land to fallow for periods up to fifteen years, turning to different fields for the next cycle. Collectively owned lands are parceled out during the dry season, and the fields are burned just before the onset of the first rains, usually around March. Farmers work most intensively during the rains between May and October, planting, weeding and protecting the crops from birds and animals. Harvesting begins in September and October with the early varieties of sorghum. The main harvest occurs in November and December. Farmers harvest crops of rice and berbéré, grown along receding water courses, as late as February. In the temporary paddies of Lake Chad, farmers grow a wide range of crops. Two harvests per year for corn, sorghum, and legumes are possible from February or March to September. Rice ripens in February and wheat ripens in May.
-
Sudanian zone: The cropping cycle for most of the sudanian zone is similar to that of the Sahelian, although the variety of crops planted is broader because of a longer rainy season and more soil moisture.
Methodology
The most recent description available of the methods used for crop estimation in Chad is found in a report prepared after a preliminary crop assessment effort in 2017 entitled Preliminary evaluation of harvests, agro-pastoral campaign of 2016/2017 (Mission Conjointe CILSS/FAO/PAM/FEWS NET/CE-JRC-UE/Gouvernement d’evaluation preliminaire des recoltes campagne agro-pastorale 2016/2017, Tchad). According to that report:
The crop estimation exercise covers 18 administrative regions out of [a total of] 23, (the agricultural part of the country). It is an annual exercise and includes household characteristics (sex, size, age, etc.) and land area and yields observed for cereals, legumes, oilseeds and tubers, and household stocks.
It is a two-stage sample survey. The primary units are those villages identified in the 2009 Census. The secondary units are the agricultural exploitations (farms). The sample permits estimates to be valid at the sub-prefectural and administrative region levels. These geographic entities are therefore considered areas of study and treated as strata. As with any stratified sample, the sampling and estimations are carried out independently within each stratum.
The village sampling (3 villages per sub-prefecture) is carried out with replacement and with unequal probabilities proportional to the size of the villages in terms of household size. In the second stage, the farm sampling is carried out with equal probabilities and without replacement. In each village in the first-stage sample, the number of farms drawn is set at 5.
The sample consists of 672 villages, or 3,360 farms. The field interview team is composed of 224 investigators and 54 controllers. Each investigator in a sub-prefecture is responsible for 3 villages, or 15 farms. The controllers are at the departmental level and are responsible for monitoring the collection in the field, verifying the records and transmitting them to the central level. At the central level, a group of supervisors goes into the field from time to time to ensure that the work is being carried out properly. Another group of coders checks the records transmitted from the field before sending them for entry. Finally, the processing and analysis are carried out with the support of a consultant.
For these preliminary results, since the agricultural survey is ongoing, we used the "expert method" for production assessment. Production estimates were made using data from the ONDR (National Office for Rural Development), SODELAC (Social and Economic Planning), time series from the DPAS (National Department for Agricultural Development) and reports from the pre-assessment missions conducted from October 19 to 28, 2016, in all agricultural areas. Yields were applied based on information from these mission reports, coupled with time series data, based on whether the situation was poor, average, or better across regions.
1 Although two archives will be shown, they are the same data.
2 A “variety” is a naturally occurring, distinct subdivision of a species with unique characteristics that don't prevent it from interbreeding with other varieties of the same species. In biological classification, variety is a taxonomic rank below species and subspecies, represented by the abbreviation "var.".