Using data visualization colors
Use data visualization colors to represent data via charts, maps, and other visualizations that require many colors for clear understanding. These colors were selected for accessibility, readability, and contrast against the IPC data colors.
Refer to Visualizations for detail about when and how to use these colors. While these colors are intended to help maximize accessibility, not all combinations of these colors will be color safe, and you are responsible for verifying the usability and accessibility of any data visualizations you create using these colors.
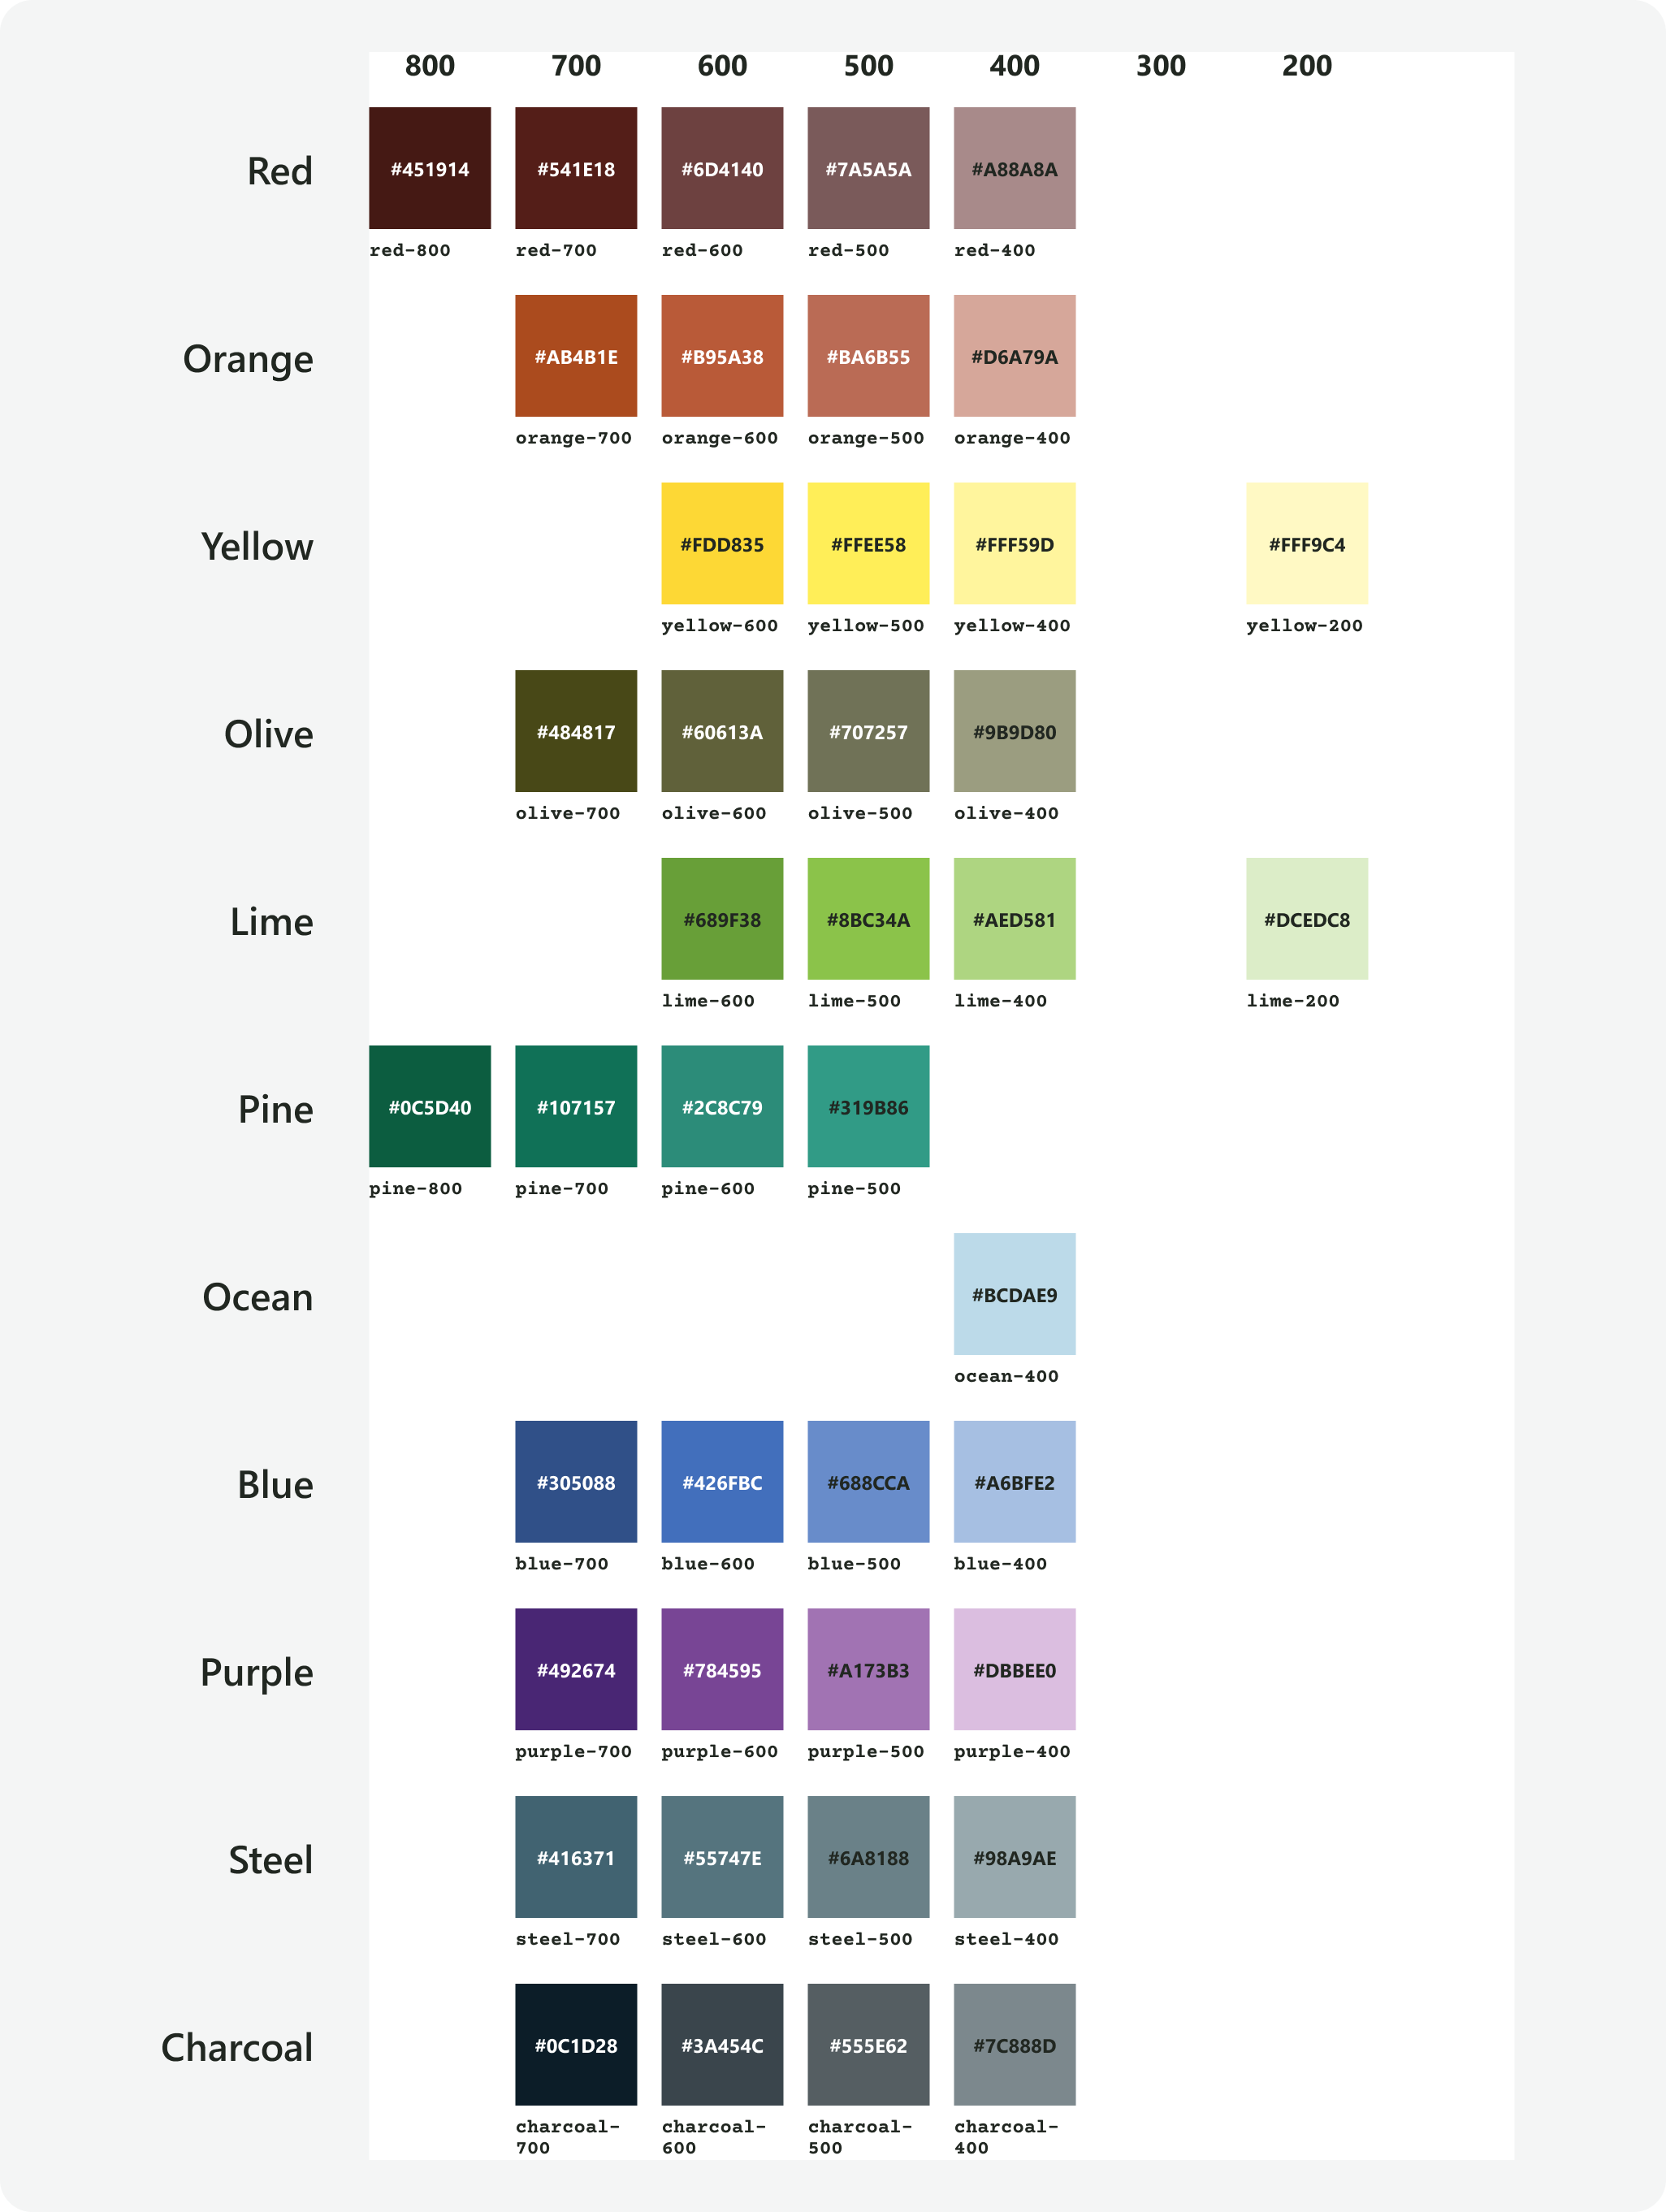
Color values
|
Color style name |
Hex value |
RGB value |
Token name |
|---|---|---|---|
|
|
#451914 |
69, 25, 20 |
base-red-800 |
|
|
#541E18 |
84, 30, 24 |
base-red-700 |
|
|
#6D4140 |
109, 65, 64 |
base-red-600 |
|
|
#7A5A5A |
122, 90, 90 |
base-red-500 |
|
|
#A88A8A |
168, 138, 138 |
base-red-400 |
|
|
#AB4B1E |
171, 75, 30 |
base-orange-700 |
|
|
#B95A38 |
185, 90, 56 |
base-orange-600 |
|
|
#BA6B55 |
186, 107, 85 |
base-orange-500 |
|
|
#D6A79A |
214, 167, 154 |
base-orange-400 |
|
|
#FDD835 |
253, 216, 53 |
base-yellow-600 |
|
|
#FFEE58 |
255, 238, 88 |
base-yellow-500 |
|
|
#FFF59D |
255, 245, 157 |
base-yellow-400 |
|
|
#FFF9C4 |
255, 249, 196 |
base-yellow-200 |
|
|
#484817 |
72, 72, 23 |
base-olive-700 |
|
|
#60613A |
96, 97, 58 |
base-olive-600 |
|
|
#707257 |
112, 114, 87 |
base-olive-500 |
|
|
#9B9D80 |
155, 157, 128 |
base-olive-400 |
|
|
#689F38 |
104, 159, 56 |
base-lime-600 |
|
|
#8BC34A |
139, 195, 74 |
base-lime-500 |
|
|
#AED581 |
174, 213, 129 |
base-lime-400 |
|
|
#DCEDC8 |
220, 237, 200 |
base-lime-200 |
|
|
#0C5D40 |
12, 93, 64 |
base-pine-800 |
|
|
#107157 |
16, 113, 87 |
base-pine-700 |
|
|
#2C8C79 |
44, 140, 121 |
base-pine-600 |
|
|
#319B86 |
49, 155, 134 |
base-pine-500 |
|
|
#BCDAE9 |
188, 218, 233 |
base-ocean-400 |
|
|
#305088 |
48, 80, 136 |
base-blue-700 |
|
|
#426FBC |
66, 111, 188 |
base-blue-600 |
|
|
#688CCA |
104, 140, 202 |
base-blue-500 |
|
|
#A6BFE2 |
166, 191, 226 |
base-blue-400 |
|
|
#492674 |
73, 38, 116 |
base-purple-700 |
|
|
#784595 |
120, 69, 149 |
base-purple-600 |
|
|
#A173B3 |
161, 115, 179 |
base-purple-500 |
|
|
#DBBEE0 |
219, 190, 224 |
base-purple-400 |
|
|
#416371 |
65, 99, 113 |
base-steel-700 |
|
|
#55747E |
85, 116, 126 |
base-steel-600 |
|
|
#6A8188 |
106, 129, 136 |
base-steel-500 |
|
|
#98A9AE |
152, 169, 174 |
base-steel-400 |
|
|
#0C1D28 |
12, 29, 40 |
base-charcoal-700 |
|
|
#3A454C |
58, 69, 76 |
base-charcoal-600 |
|
|
#555E62 |
85, 94, 98 |
base-charcoal-500 |
|
|
#7C888D |
124, 136, 141 |
base-charcoal-400 |


IPC data colors
FEWS NET uses the Integrated Food Security Phase Classification (IPC) colors on maps that display IPC-compatible analysis. See Map Body for color values and usage details.
|
Type |
Phase |
Fill color |
Additional specifications |
|---|---|---|---|
|
Acute Food Insecurity and Acute Malnutrition |
None / Minimal |
#CDFACD; RGB: 205, 250, 205
|
|
|
Stressed |
#FAE61E; RGB: 250, 230, 030 |
|
|
|
Crisis |
#E67800, RGB: 230, 120, 000 |
|
|
|
Emergency |
#C80000, RGB: 200, 0, 0 |
|
|
|
Catastrophe / Famine |
#640000, RGB: 100, 0, 0 |
|
|
|
Famine Likely |
#640000, RGB: 100, 0, 0 |
|
|
|
Chronic Food Insecurity |
None / Minimal |
#CDFACD; RGB: 205, 250, 205 |
|
|
Mild |
#CBC9E2; RGB: 203, 201, 226 |
|
|
|
Moderate |
#9E9AC8; RGB: 158, 154, 200 |
|
|
|
Severe |
#6A51A3; RGB: 106, 81, 163 |
|
|
|
All types |
Areas not analyzed |
#BDBDBD; RGB: 189, 189, 189 |
|
Contact us if you have an application question or recommended addition to these standards.