Summary

Another way to estimate changes in climate patterns is by comparing the averages between two periods within a time-series. The Long-Term Changes in Averages tool (red box in Figure 8‑1) allows you to estimate the trend by dividing the time-series into two groups of years and calculating the difference in average between the two groups (difference = group2-group1).
8.1. Calculating changes in averages
To run the tool, follow the steps below:
-
Open the Long-Term Changes in Averages tool from the main toolbar, see Figure 8‑1.
-
Select the season to be analyzed, see Figure 8‑2 (1).
-
In series 1, select the first period of time, see Figure 8‑2 (2).
-
In series 2, select the second period, see Figure 8‑2 (3).
-
Click Process to finish.
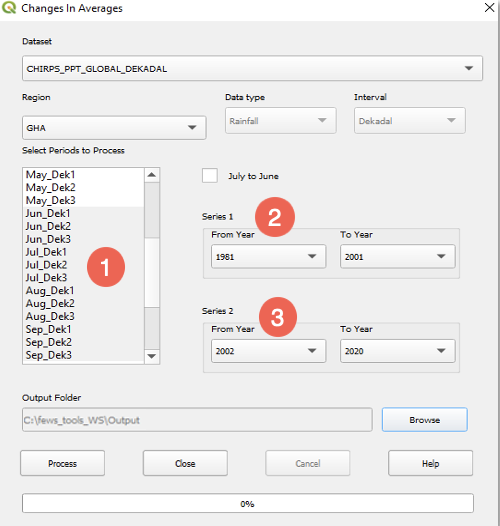
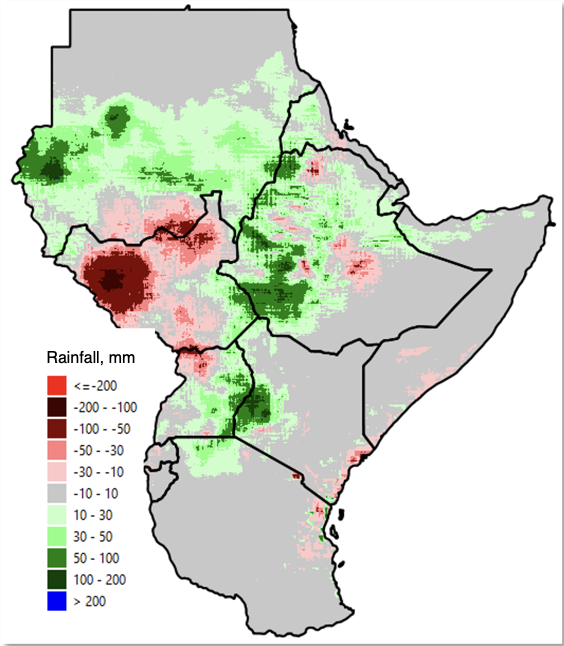
Figure 8‑3 shows the output map result of the change in average from the 1981-2001 period (series 1) compared to the 2002-2020 period (series 2), for the June-September season. The result shows areas with increasing (green-blue) and decreasing (pink-red) mm of rainfall during the 2002-2020 period.