The Crop Assessment Dashboard displays field observations collected using the Open Data Kit (ODK) app during FEWS NET’s crop assessment tours. Data collected in the dashboard include geographic location, observations and classifications of crop condition, crop condition drivers, and photos of crop conditions.
The dashboard has the following main components:
-
Individual crop conditions
-
Scatterplot from tour
-
Images from tour
-
Summary crop details
-
-
Aggregated crop conditions
-
Choropleth map
-
Individual crop conditions
Select a location on the scatterplot to view images and crop summary details for that observation point. You can use the options outlined below to filter the information shown on the scatterplot and summary table.
Options
-
Select form: Choose one of the available forms to filter the observation points shown on the scatterplot based on the form used to conduct the survey.
-
Select survey year: Choose a survey year.
-
Select crop: Choose one or more crops to filter the observation points shown on the scatterplot.
-
Select admin 2 level on the scatter map: Choose one or more admin 2 levels to filter the observation points shown on the scatterplot.
-
Select column to view categories: Choose a variable to update the categories shown on the scatterplot.
-
Select columns to show in summary table: Choose one or more indicators to filter the information included in the summary table.
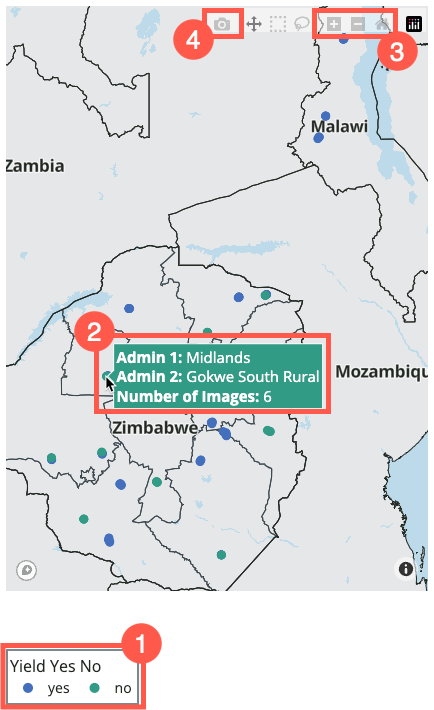
Scatterplot from tour
The scatterplot shows the geographic locations of the observation points where data was collected. Selecting the mapped observation location point will populate the images and the summary table with data from that location.
You can interact with the scatterplot in the following ways:
-
Single click on a legend item to exclude it from the map or add it back to the map.
-
Hover over an observation point to view the Admin 1 and Admin 2 names, and number of images available.
-
Zoom in and out of the map using your mouse scroll wheel, touchpad, or the zoom buttons in the top right corner. To return to the default zoom level, double click on the map or choose the home button.
-
Click on the camera icon in the top right corner to download the map as a .png file.
Images from tour
The image carousel displays photos of field conditions from the selected observation point. Use the arrows to move between the available photos.
Summary crop details
The summary table shows the data collected for a number of indicators for the selected observation point.
Aggregated crop conditions
Options
-
Select column to visualize on the choropleth map: Choose a variable to visualize on the map.
-
Select Admin 1 level: Adjust the map to only show data for specified Admin 1 Units.
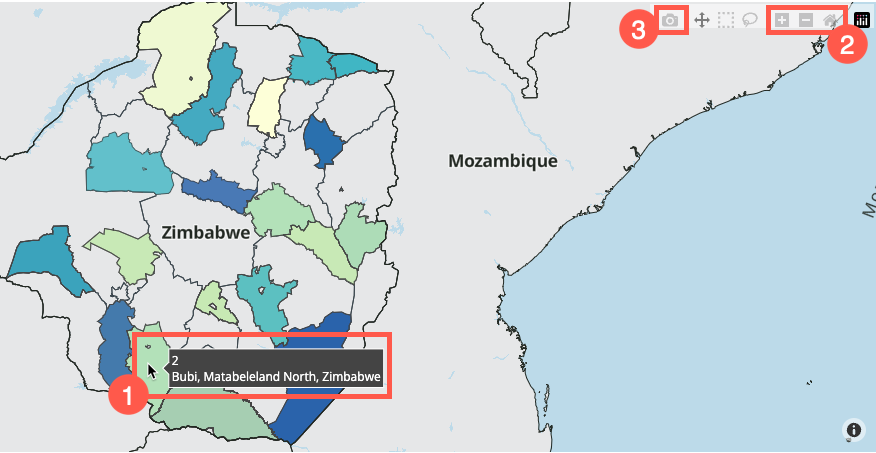
Choropleth map
The choropleth map shows aggregated values per Admin 2 Unit for a number of variables.
You can interact with the scatterplot in the following ways:
-
Hover over a Geographic Unit to view the value, and Admin 1 and Admin 2 names.
-
Zoom in and out of the map using your mouse scroll wheel, touchpad, or the zoom buttons in the top right corner. To return to the default zoom level, double click on the map or choose the home button.
-
Click on the camera icon in the top right corner to download the map as a .png file.