The Trade Partner Dependency Dashboard uses data from UN Comtrade to visualize the dependence of a specified country on imports of various products or from particular countries. Users select the importing country and product categories and can filter information based on an exporting country or a specific product.
Data overview
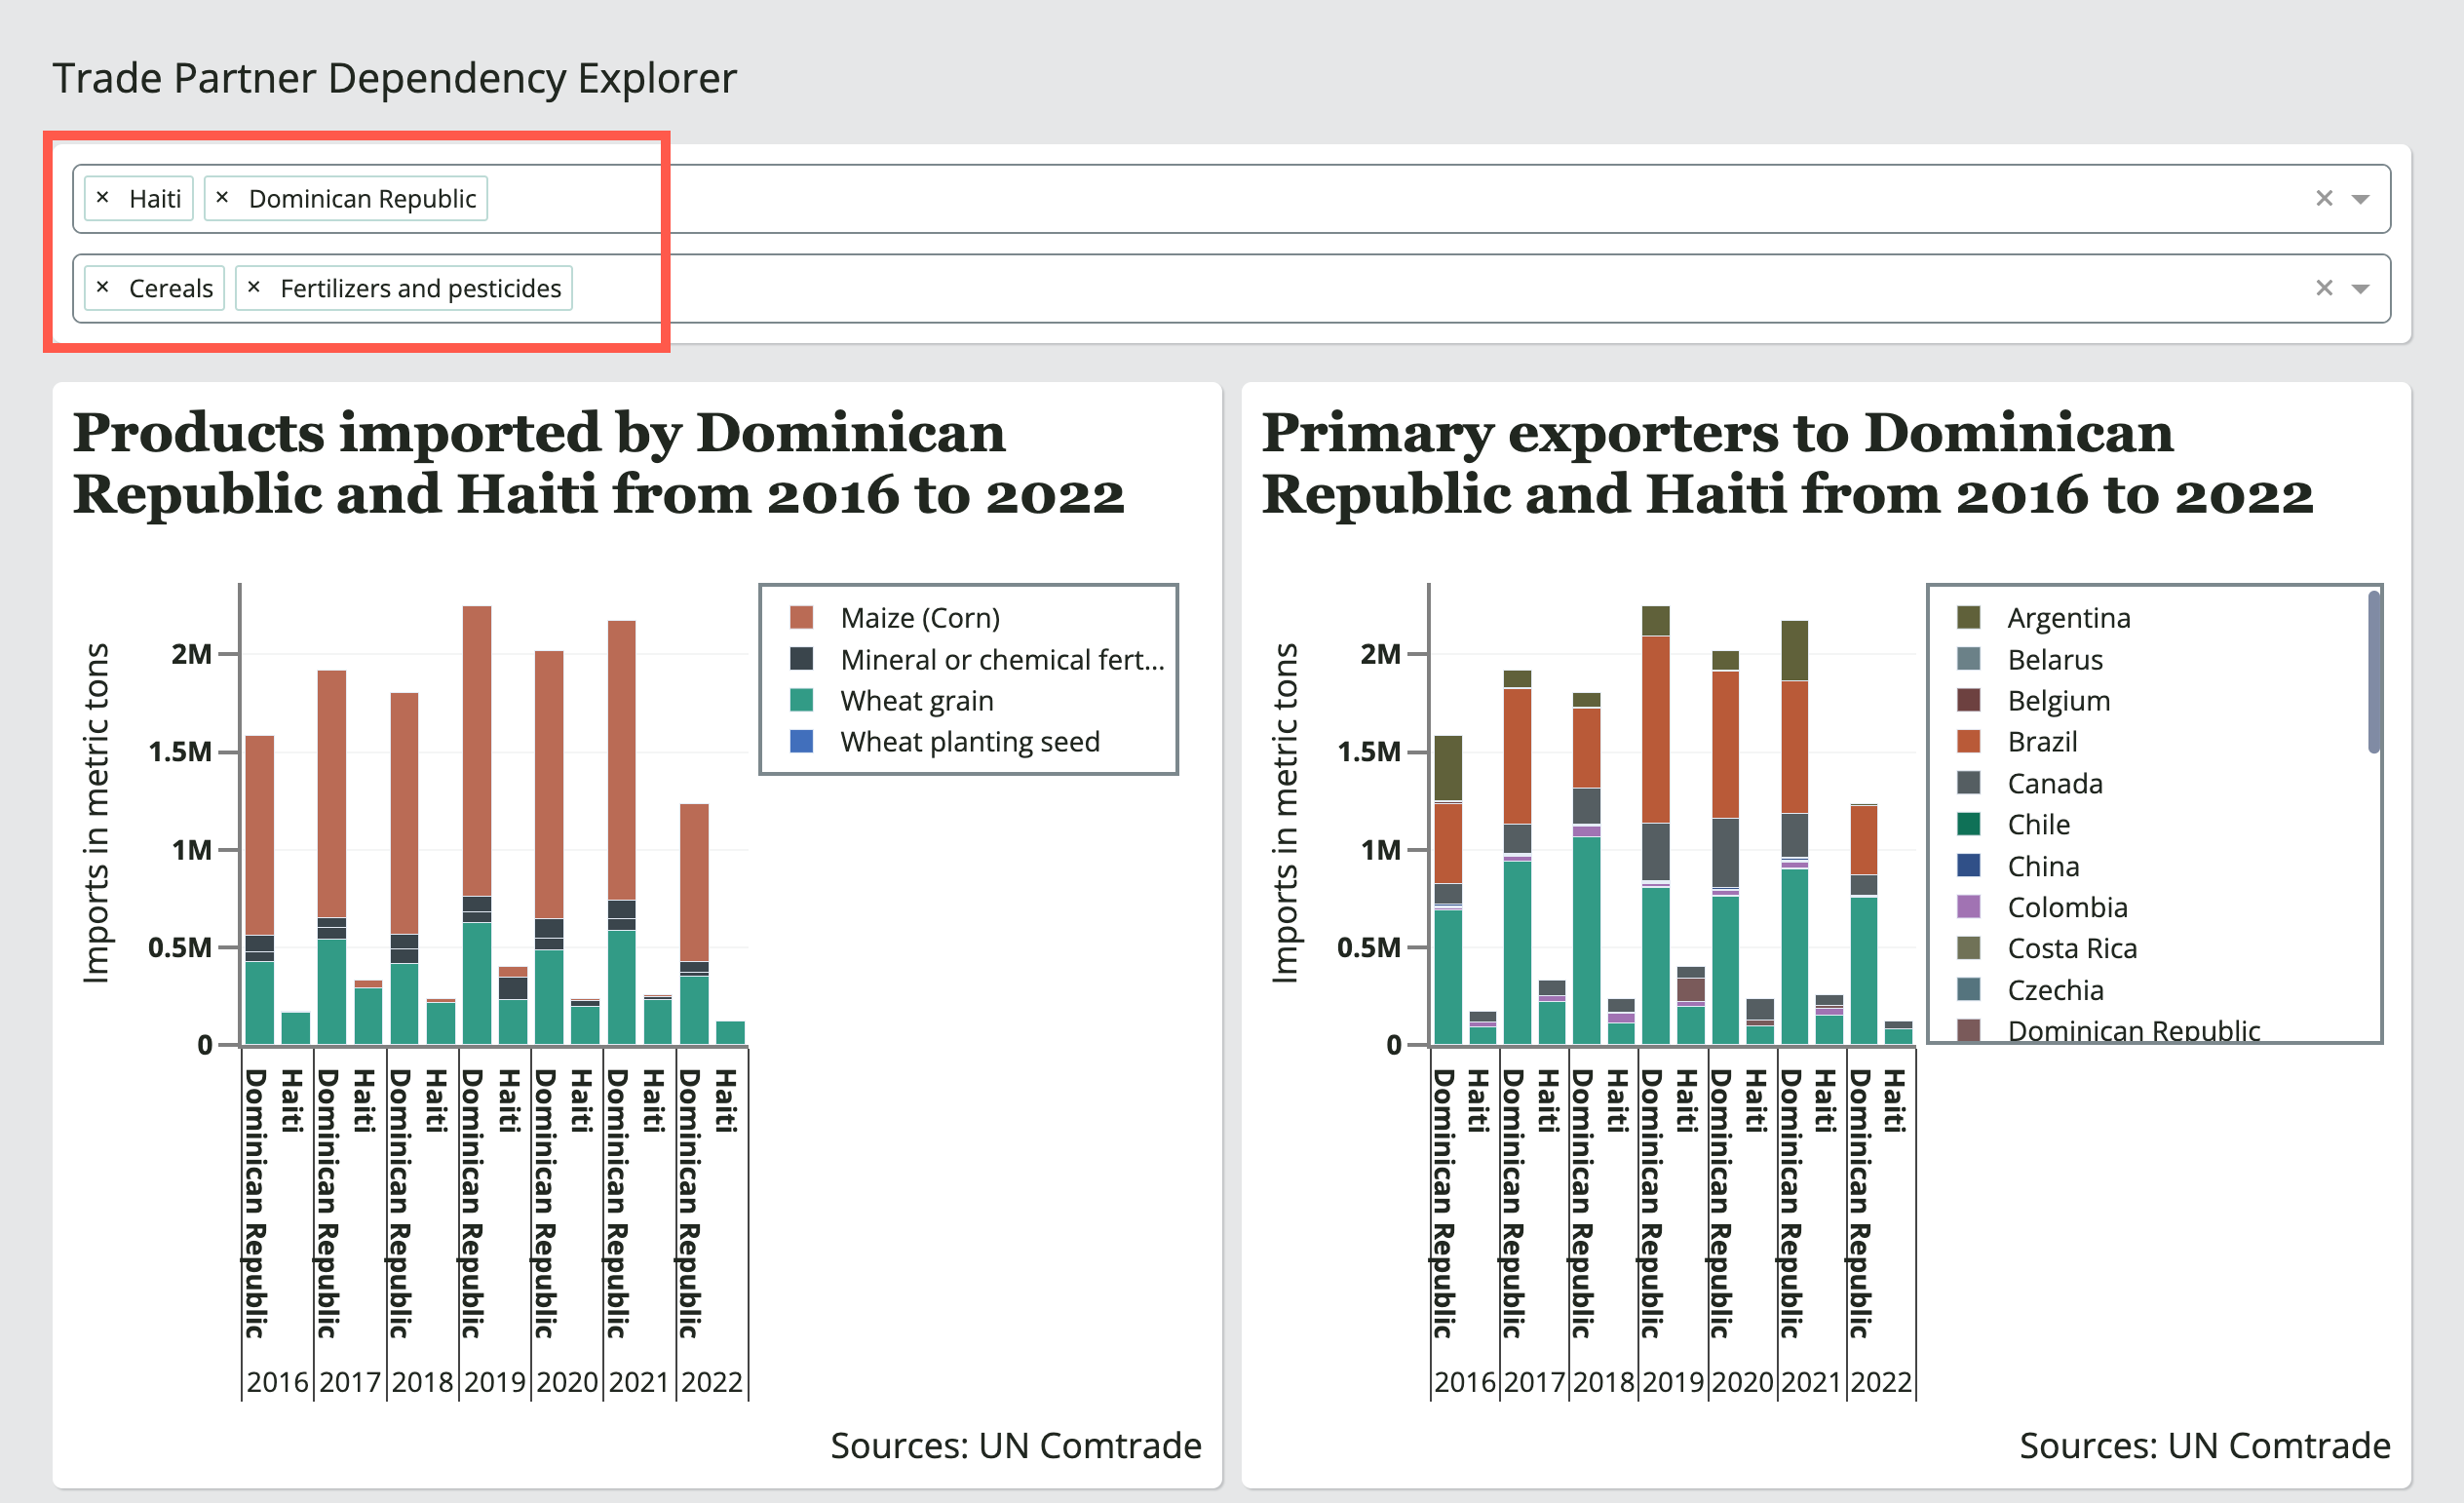
The first section shows an overview of the products imported and primary exporters to the selected countries for the selected product group(s).
Options
To get started:
-
You must select one or more importing countries. You can find a country by scrolling through the drop-down menu or typing it into the search bar.
-
Optionally, you can select one or more product groups to filter the available data.
Visualizations
Once a country is selected, the system will populate the following graphs:
-
Products imported by year graph: This stacked bar chart shows the imports in metric tons for each item in the selected product categories for each selected country, over the last seven years. (e.g., you can view the total amount of wheat grain imported by Haiti and the Dominican Republic last year.)
-
Primary exporters by year graph: This stacked bar chart shows the imports in metric tons from every country that exports to each selected country, over the last seven years. (e.g., you can view the total amount the United States exported to Guatemala in 2022.)
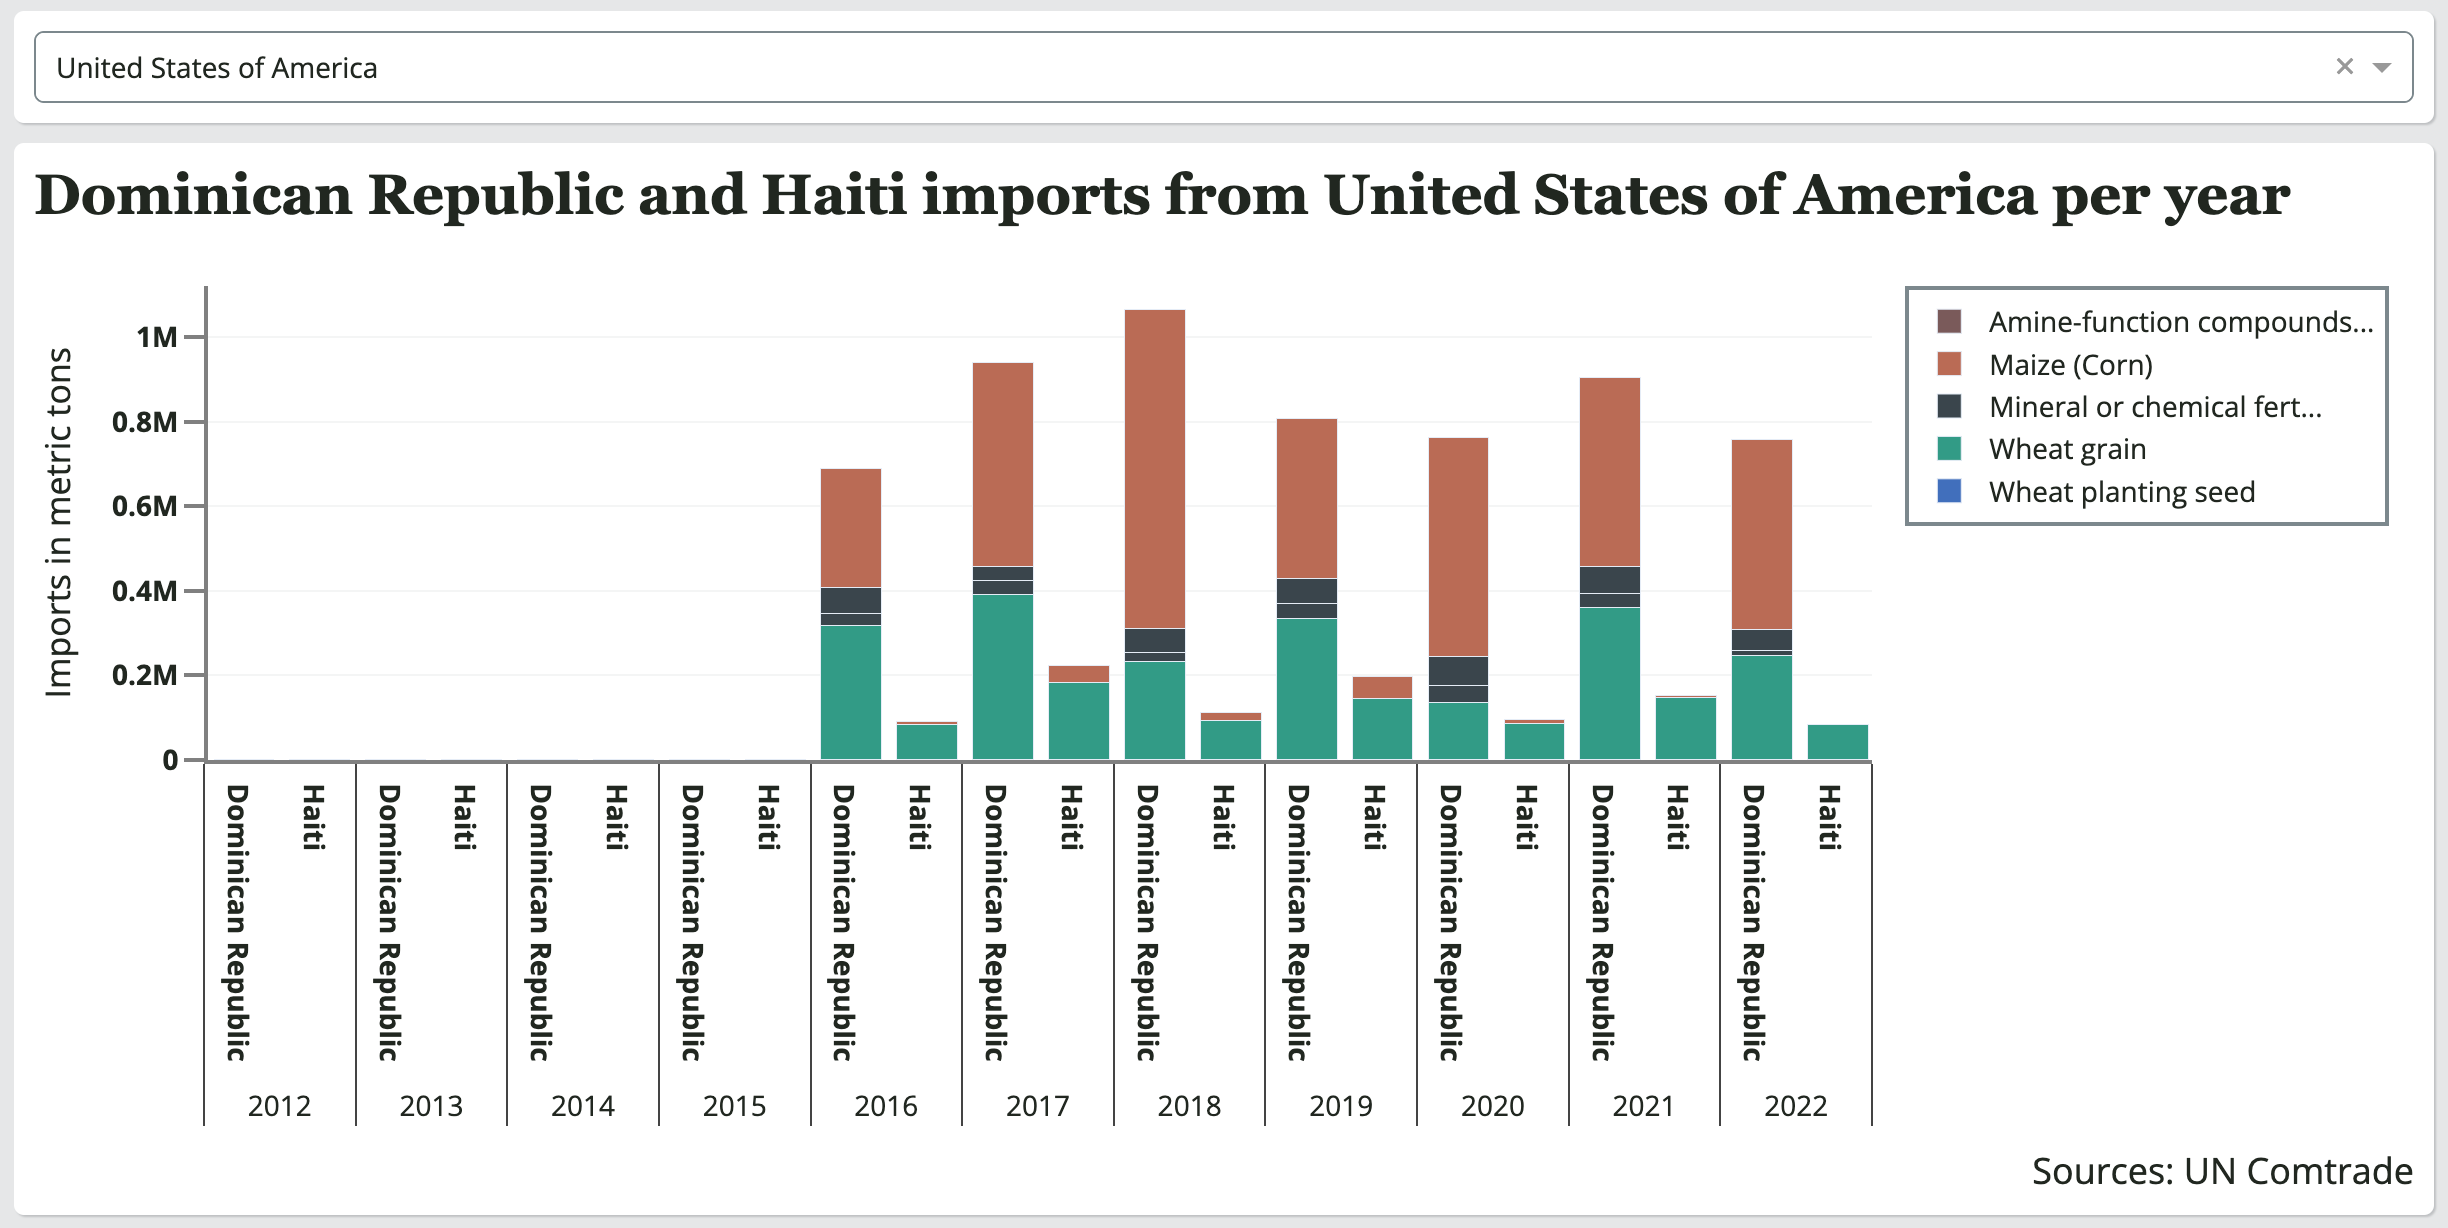
Export country specific visualization
Pick a country from the drop down list to view more details. This list will only display countries which appear in the Primary exporters by year graph.
Note: By default, the system selects the first country in the menu.
The system will then populate the Imports from a country per year graph. This stacked bar chart shows the imports per metric ton of items in the previously selected product categories from one country, over the last ten years.
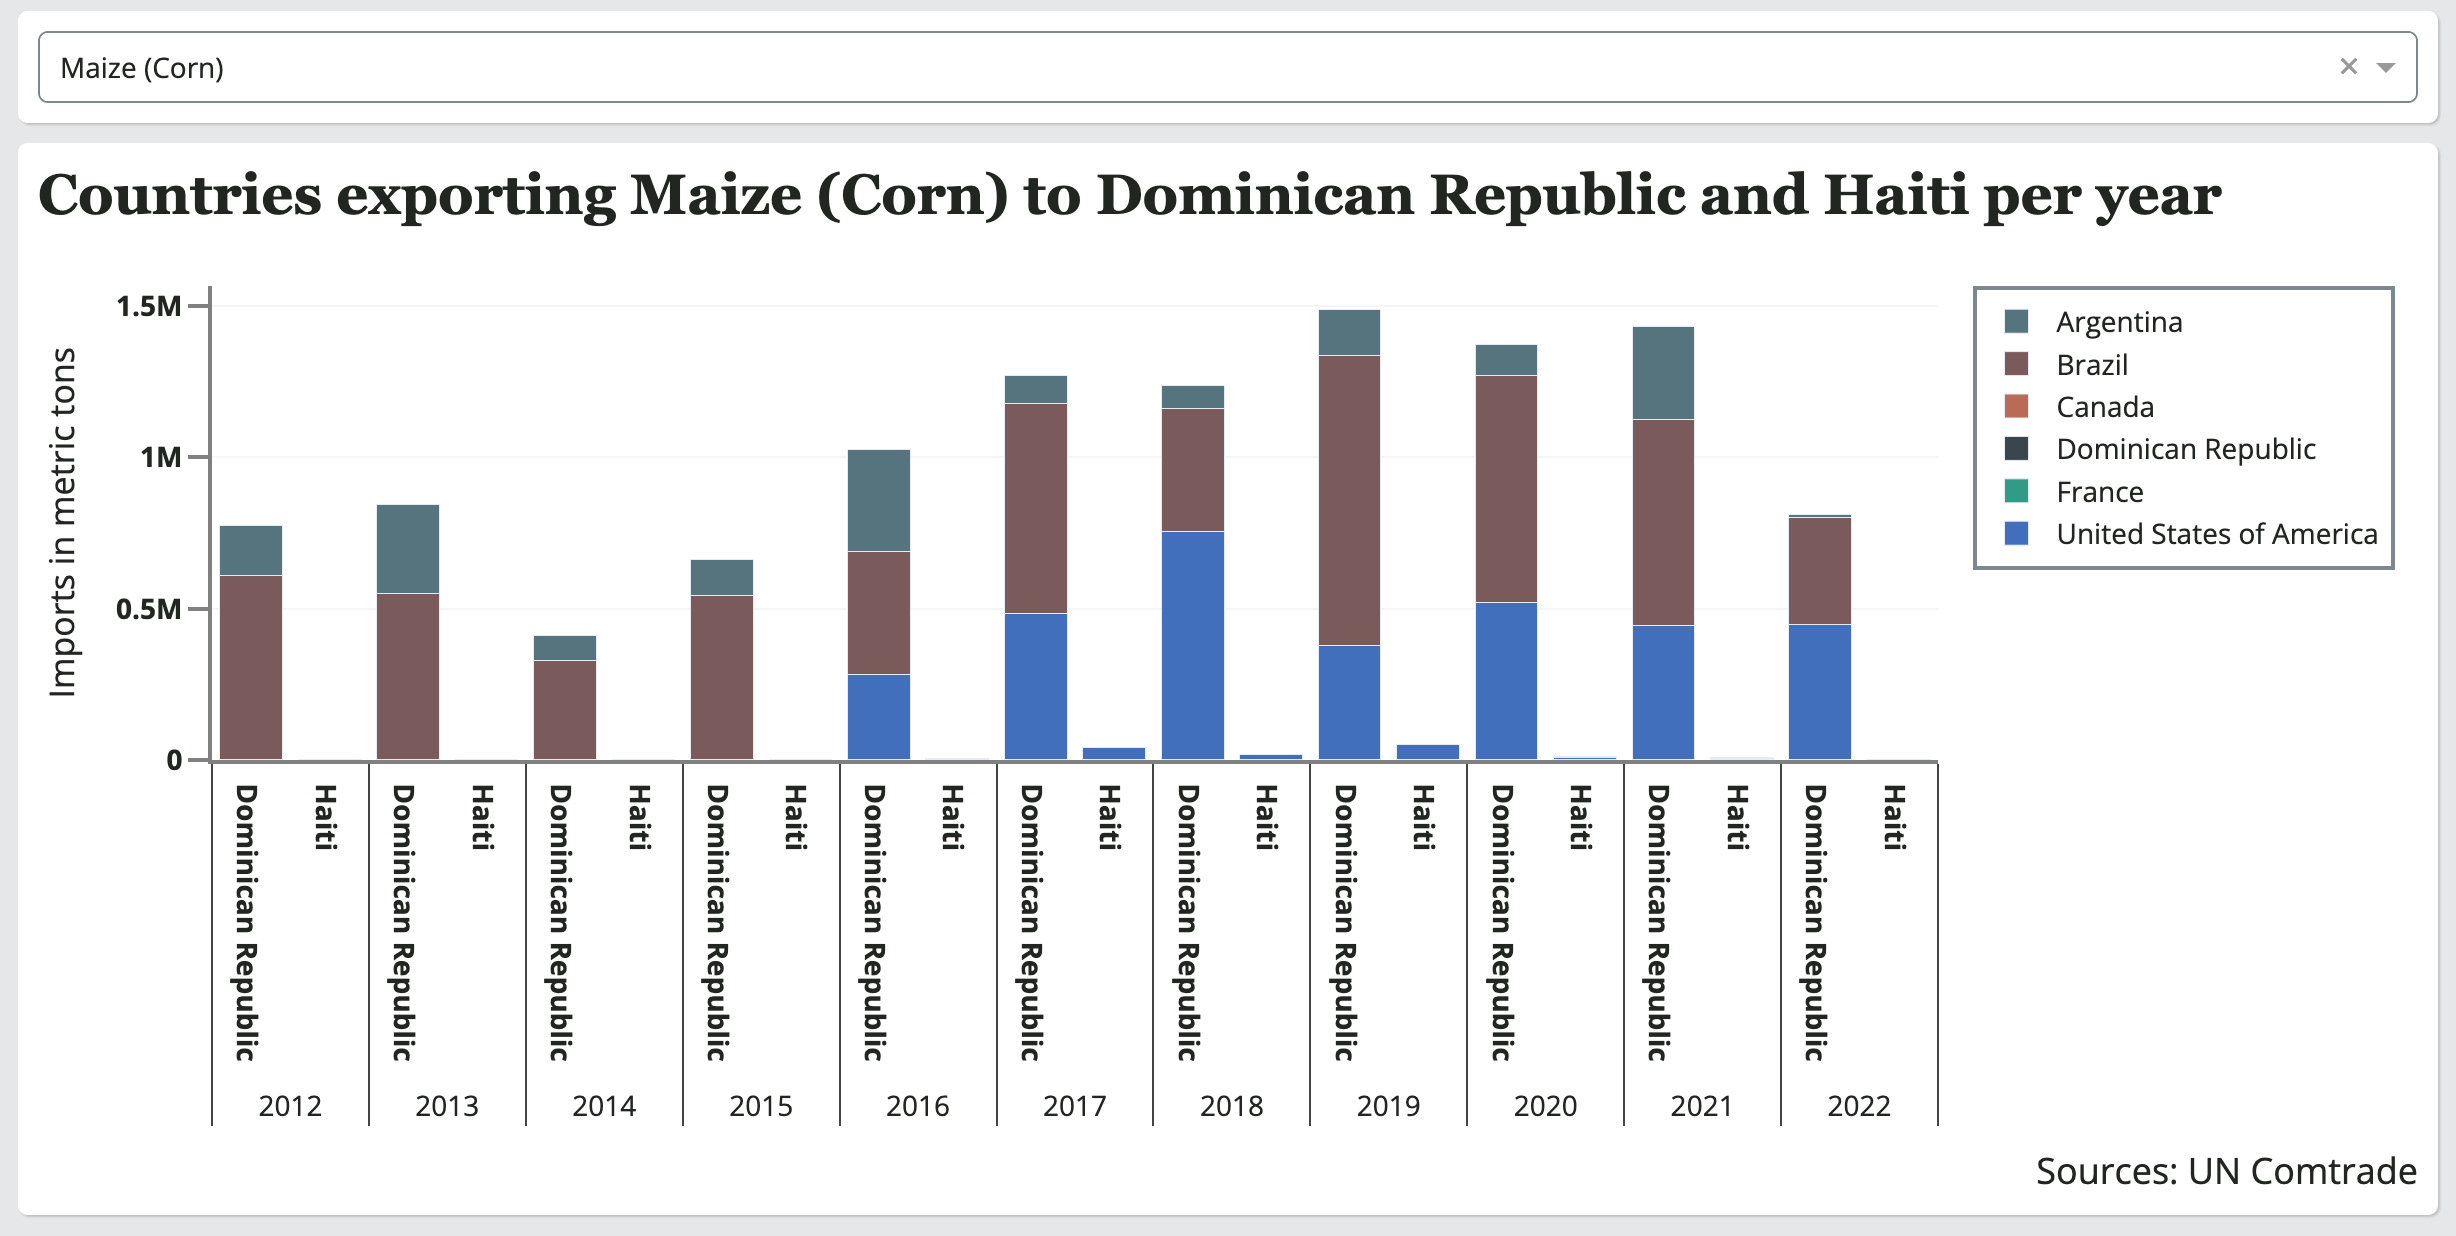
Product-specific Visualizations
Pick a product from the drop down list to view more details. This list will only display products from the previously selected product categories.
Note: By default, the system selects the first product in the menu.
The system will then populate the Countries exporting a product per year graph. This stacked bar chart shows the imports per metric ton of the selected product from every country that has exported that product to each selected country, over the last ten years.
Tips for interacting with Visualizations
-
Hover over a line, bar, or area of a map to see a specific number value.
-
Single click on a legend item to exclude it from the graph.
-
Double click on a legend item to display only its trace.
-
Use your mouse to draw a box around any part of the graph to zoom in.
-
Double click on the graph background to return it into the initial zoom state.