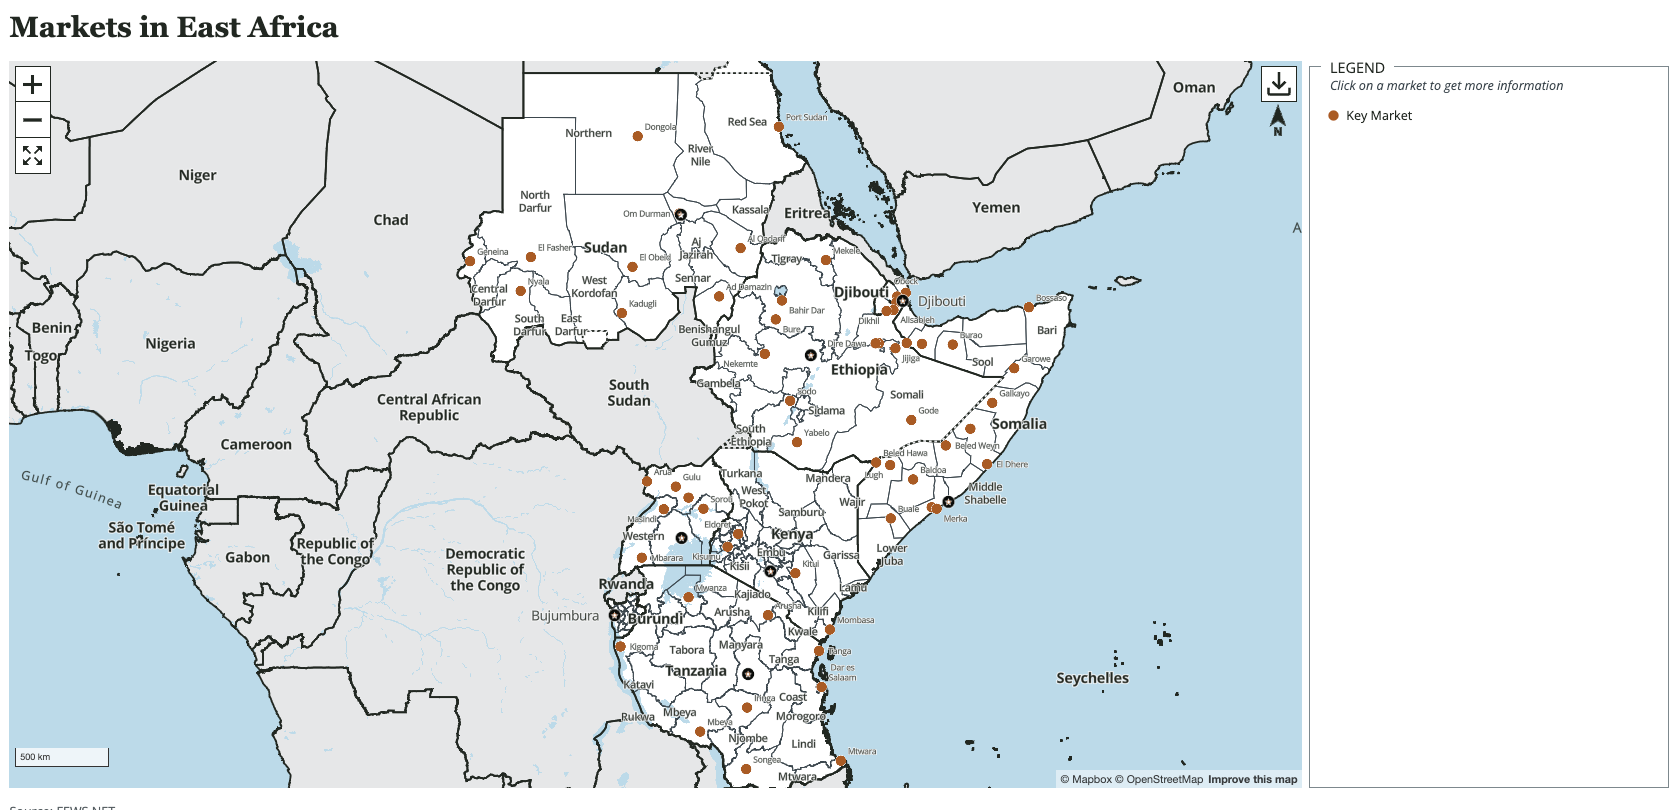
The Markets Map visualization is a map that displays key markets in a country or region.
Use the following guidelines to create a Markets Map visualization.
* = typically required for reports
Standard visualization fields
Internal Title: This field is optional and will not show up in the report. You may use it to help you quickly identify a specific visualization in your report in the CMS.
*Alt Text: Provide a brief description of what the visualization shows. Learn more about writing alt text for FEWS NET visualizations.
*Show Figure Label: If the visualization is referred to in the text of the report and needs a figure number (i.e. Figure 1), make sure this toggle is turned on. Keep this toggle off for visualizations being used in country and region pages.
*Pick a visualization type: Choose markets Map.
Visualization specific fields
*Data selection fields
Choose either one dataset or one or more data series.
Data series: You can select multiple data series by holding down the CTRL button.
Dataset: You can use the search box to search datasets by user name and title.
*Country/region fields
Select an item from one of these dropdown boxes. Do not select both a country and a geographic group.
Select a country: Select a country if you are creating a country report.
Select a geographic group: Select a geographic group if you are creating a regional report.
Auto-generated fields
All of these fields will be automatically generated but can be overridden if desired.
Visualization title: The auto-generated title will be formatted as follows:
|
|
Formula |
Example |
|---|---|---|
|
Title |
Markets in {Country or Region} |
Markets in East Africa Markets in Ethiopia |
Disclaimer: This is blank by default for this chart. However, it can be used to add a custom disclaimer when required (e.g., to explain missing data).
Source Attribution: The auto-generated source attribution is a compilation of the data source organization names stored in FDW for the data used to create the map.
Generate the visualization
*+Generate URL: Click this button once you have filled out the fields above to generate the visualization. The system will provide a thumbnail of the visualization and a URL where you can preview the visualization. Note: It may take a minute to generate the thumbnail image. Make sure you allow the thumbnail to load before saving the visualization.
The system will automatically populate the remaining fields: Data Visualization Type, Primary URL, Image URL, and JSON Configuration. These SHOULD NOT be edited.
PDF formatting options
Show full width in PDF: By default, this toggle should be turned off. You may want to show a visualization in full width if you have a very detailed chart that needs to be larger than 50% of the page width.
Float Position: Sets the orientation data visualizations that are not full width. Defaults to Right. For side-by-side images, set the first image to Left. For full width images, set to None.