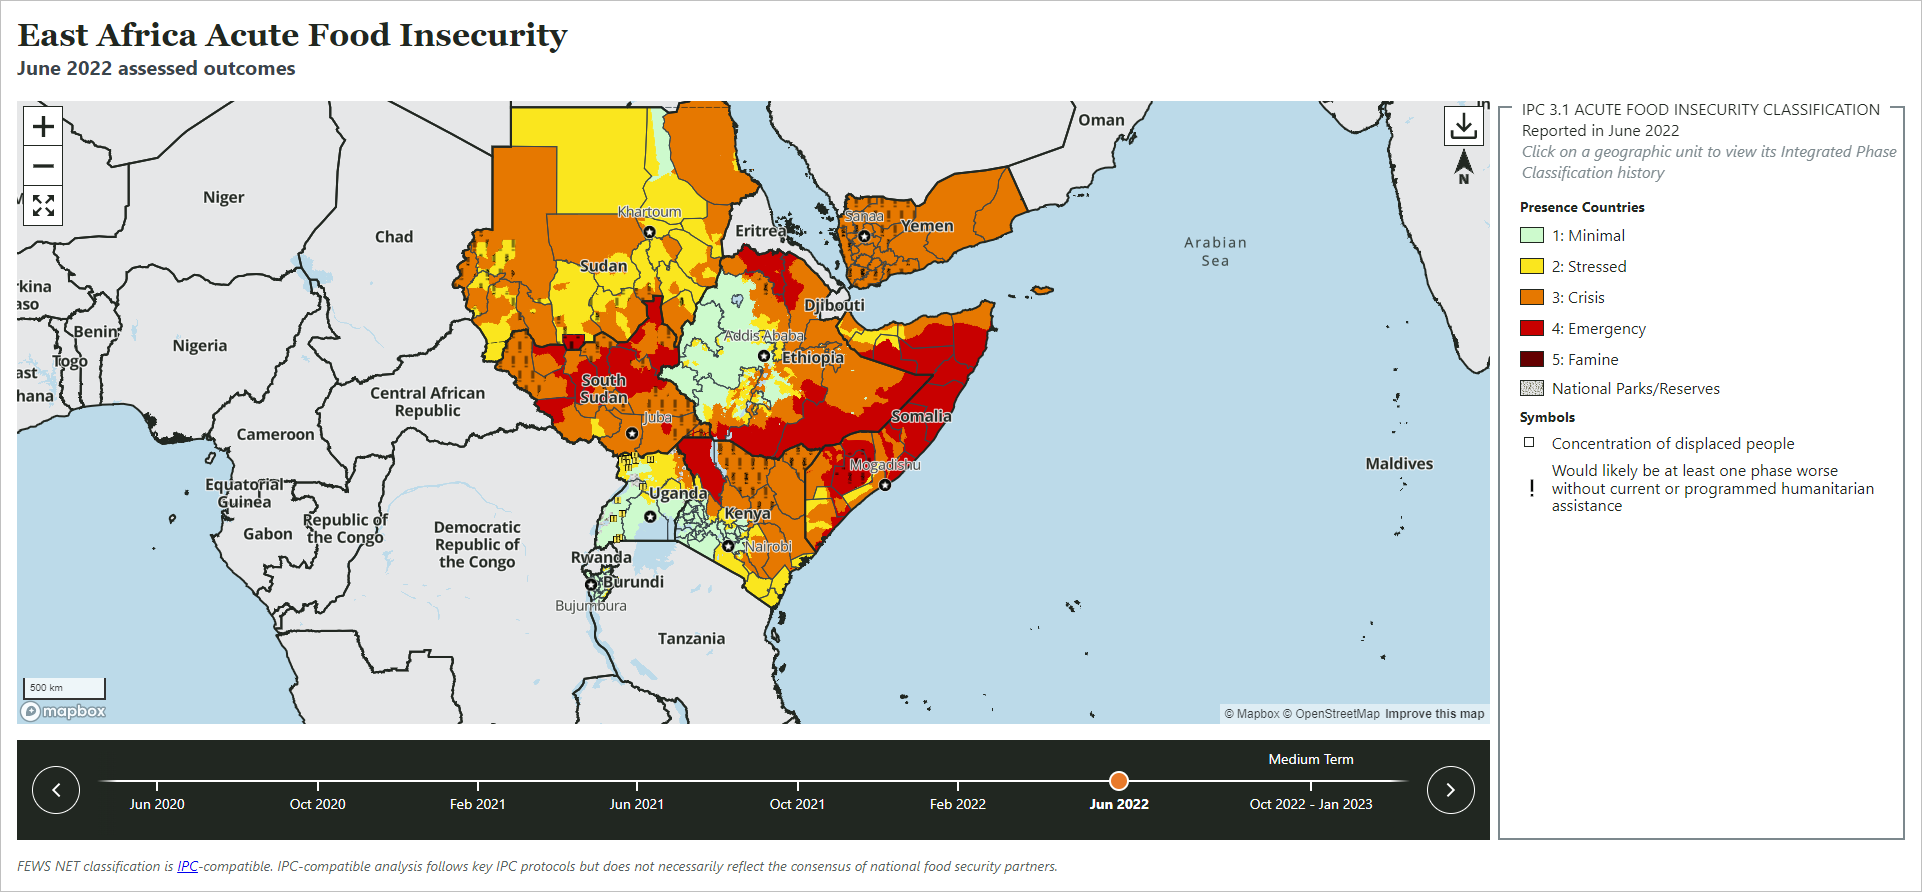
The Acute Food Insecurity visualization is a map with timeline, that displays food security outcomes together with the near and medium term projections. This visualization is normally the first and last item on all Food Security reports (FSO, FSOU, KMU) as well as on Country and Regional pages.
To build a Single Scenario Acute Food Insecurity visualization displaying a single scenario and no timeline, refer to the guidance found here.
Use the following guidelines to create an Acute Food Insecurity visualization.
* = typically required for reports
+ = typically required for country and region pages
Creating a visualization in the CMS before the data has been published will lead to issues with report images. Make sure you wait for the confirmation message in the FDW.
Standard visualization fields
Internal Title: This field is optional and will not show up in the report. You may use it to help you quickly identify a specific visualization in your report in the CMS.
*+Alt Text: Provide a brief description of what the visualization shows. Learn more about writing alt text for FEWS NET visualizations.
*Show Figure Label: If the visualization is referred to in the text of the report and needs a figure number (i.e. Figure 1), make sure this toggle is turned on. Keep this toggle off for visualizations being used in country and region pages.
*+Pick a visualization type: Choose Acute Food Insecurity Map.
Visualization specific fields
*+Country/region fields
Select an item from one of these dropdown boxes. Do not select both a country and a geographic group.
Select a country: Select a country if you are creating a country report.
Select a geographic group: Select a geographic group if you are creating a regional report.
Date fields
*Collection date: A collection date is needed to ensure that the data doesn’t automatically update every month. The collection date is the first day of the month in which the report is published. For example, October 1, 2022 would be used for the October 2022 Outlook. The corresponding map will only display data up to October 2022, even as new data becomes available.
If the visualization is being used on a country or a region page, rather than in a report, then the Collection Date should be left blank so that the visualization updates automatically as new data is published.
Start date: This is normally left blank but can be used to limit the data shown on the map timeline. If a start date is entered, that will be the first date shown on the timeline and any data before that date will not be shown.
Map specific fields
Note: The first two map specific fields affect only the static maps displayed in the auto-generated PDF version of the report.
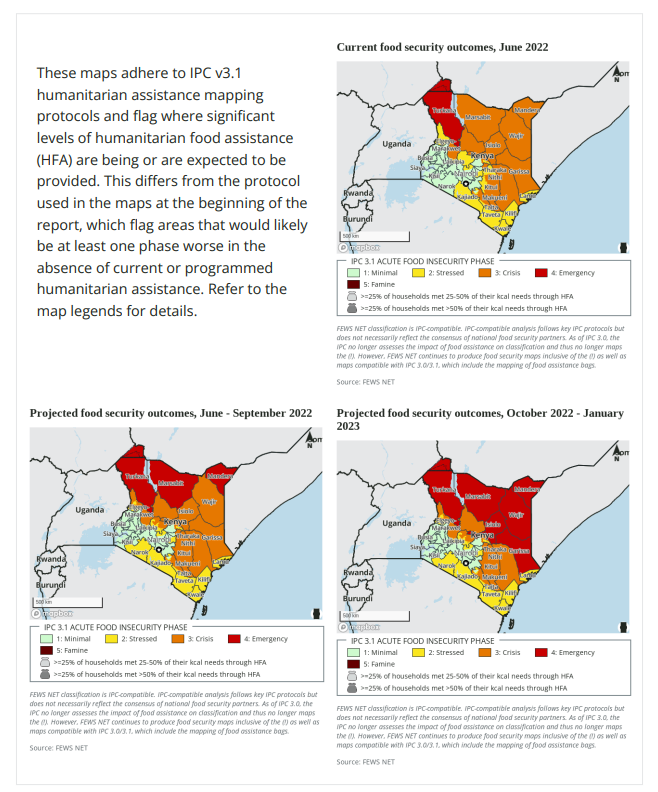
Select one or more scenarios for the static map: This field allows you to choose which static map views will be included in a PDF version of the report. If this field is left blank, all available scenarios will be included as applicable to the report type. Note: When building this map for the Key Messages section of an FSO, select Near Term Projection and Medium Term Projection. Use the CTRL key (Windows) or COMMAND key (Mac) to select multiple options.
*Select static map layout type: Select a layout unless you have chosen only one scenario from the previous field. This field indicates if the map views chosen in the previous field are laid out horizontally, vertically, or in a gird within the PDF report. If left blank, this will default to a vertical layout.
Note: The grid option is most useful when Show HFA data is selected otherwise there will be a blank square in the grid. See the image below for example. If you choose horizontal or grid, make sure the Show full width in PDF toggle above is turned on.
*Show HFA data: Selecting this checkbox will display the HFA wheat bag icons instead of the FEWS NET “Allowing for assistance” exclamation point icons on the map. Typically, when the acute food insecurity map is used, you will need to add it to the report twice:
-
At the beginning of the report leave this checkbox blank to show FEWS NET’s standard map.
-
At the end of the report check this box to show HFA data so the report is IPC compatible. Note that HFA may not be available in all cases. If HFA data is not available, skip this visualization.
Auto-generated fields
All of these fields will be automatically generated but can be overridden if desired.
Visualization title: The auto-generated title will be formatted as follows:
|
|
Formula |
Example |
|---|---|---|
|
Title |
{Country/Region name} Acute Food Insecurity |
East Africa Food Insecurity |
|
Subtitle |
{Period month} assessed outcomes |
June 2022 assessed outcomes |
Disclaimer: The auto-generated disclaimer is “FEWS NET classification is IPC-compatible. IPC-compatible analysis follows key IPC protocols but does not necessarily reflect the consensus of national food security partners.” If this map is for Ethiopia, it will also contain the standard disclaimer about Ethiopia administrative boundaries.
Source Attribution: The auto-generated source attribution is a compilation of the data source organization names stored in FDW for the data used to create the map.
Generate the visualization
*+Generate URL: Click this button once you have filled out the fields above to generate the visualization. The system will provide a thumbnail of the visualization and a URL where you can preview the visualization. Note: It may take a minute to generate the thumbnail image. Make sure you allow the thumbnail to load before saving the visualization.
The system will automatically populate the remaining fields: Data Visualization Type, Primary URL, Image URL, and JSON Configuration. These SHOULD NOT be edited.
PDF formatting options
Show full width in PDF: By default, this toggle should be turned off. You may want to show a visualization in full width if you have a very detailed chart that needs to be larger than 50% of the page width.
Float Position: Sets the orientation data visualizations that are not full width. Defaults to Right. For side-by-side images, set the first image to Left. For full width images, set to None.