1.0. The FEWS Tools Main Toolbar
a. Setting Functions
i. Workspace Settings
ii. Output Directory Settings
iii. Add/Edit Datasets
iv. Add/Edit Regions
b. Data Management Functions
i. Import climate data archives
ii. Download climate data
iii. View list of available data
c. GeoCLIM Analysis Functions
i. Climatological data analysis; average, SPI, etc.
ii. View rainfall summaries
iii. Climate composites
iv. Make contours
v. Calculate long-term changes in averages
vi. BASIICS: raster-station blending, station interpolation
vii. Extract statistics from raster datasets
d. GeoWRSI Analysis Functions
i. Add/Edit Crops
ii. WRSI Settings
iii. Run WRSI
iv. Climatological WRSI/SOS Analysis
v. WRSI Output Settings
Summary
Figure 1‑0 above shows the primary tools available in the FEWS Tools plugin. These tools consist of settings, data management, and analysis methods for both GeoCLIM and GeoWRSI. This chapter briefly describes the main functions, and the following chapters look at each tool in detail.
Settings Functions
1.1. Setup the Workspace
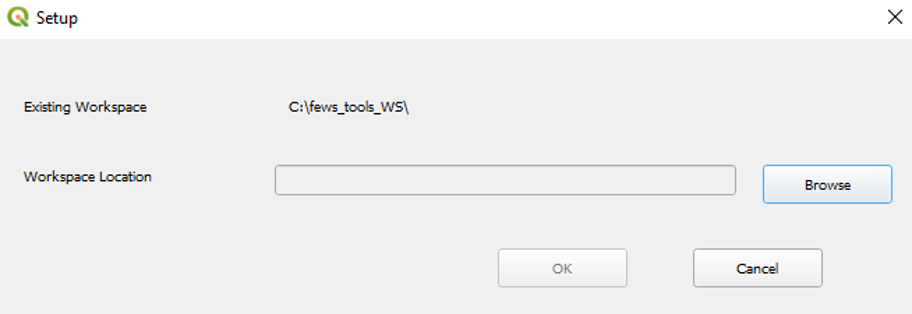
The default location of the workspace is C:\Users\[USER]\Documents\fews_tools. However, you can change the location to a different drive based on memory availability and access, see Figure 1-1. See more about how to change the workspace in chapter 2.
1.2. Output Options
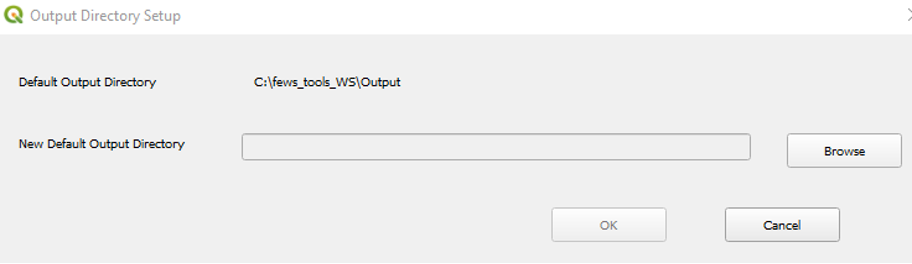
You can change the default output directory where the results from the different functions are deposited. This is done in case you want to save all the results for a given project in the same place. Browse to the new directory and click the OK button, see Figure 1-2.
1.3. Add/Edit Datasets
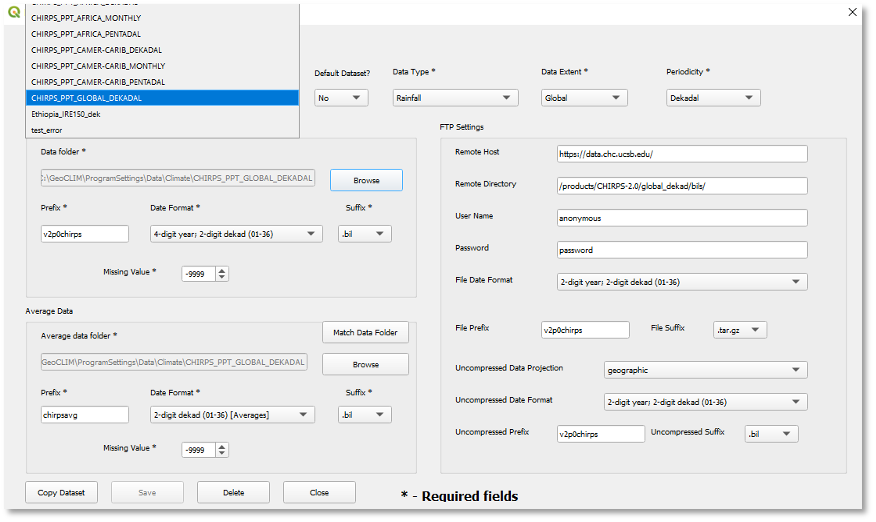
The FEWS Tools plugin requires that raster data be registered in the database to be used by the different functions. The registration is done by completing the Add/Edit Datasets form, Figure 1‑3. The tool includes a few dataset definitions by default, but you could add others. See chapter 2 for more information on how to add new datasets.
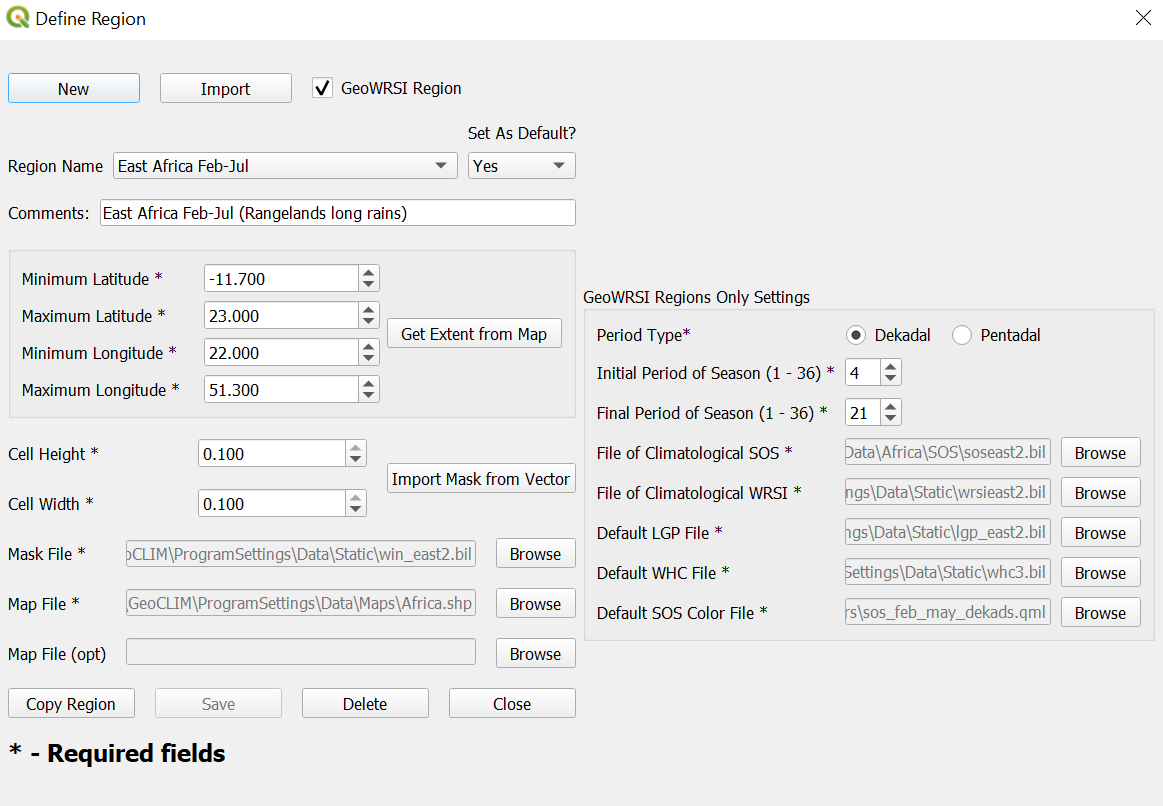
1.4. Add/Edit Regions
FEWS Tools run on predefined areas of study or regions. A region is composed of the lat/long box and a mask file which is a raster dataset that further defines the region of interest (Figure 1-4). See more about how to create or edit regions in chapter 2.
1.5. Import Climate Data Archives
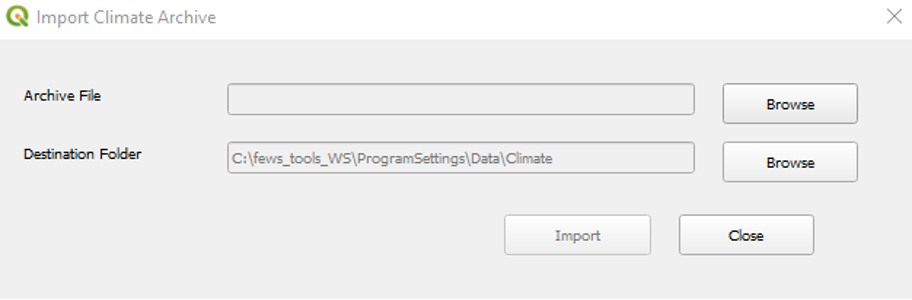
An archive is a compressed file containing data for a climate variable including all the settings to make the dataset ready to be used in the program. The Import Climate Archives tool, Figure 1-5, makes datasets available in fews_tools. These archive files are useful for sharing data among GeoCLIM users. For information on creating data archives, see chapter 3.
1.6. Download Climate Data
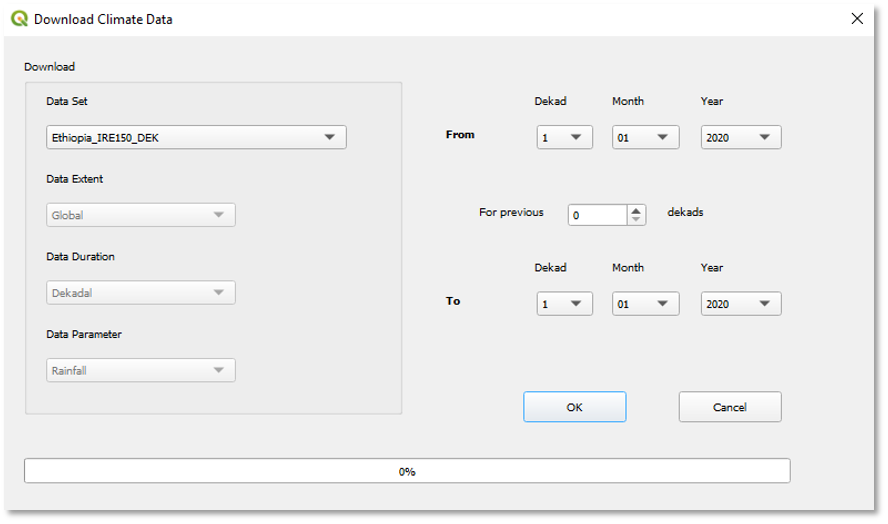
The Download Climate Data tool, Figure 1-6, facilitates bulk downloads of available climate data via FTP, HTTP, or HTTPS from different sources (e.g., UCSB, USGS, etc.). See chapter 3 for more information on FEWS Tools data management.
1.7. View Available Data
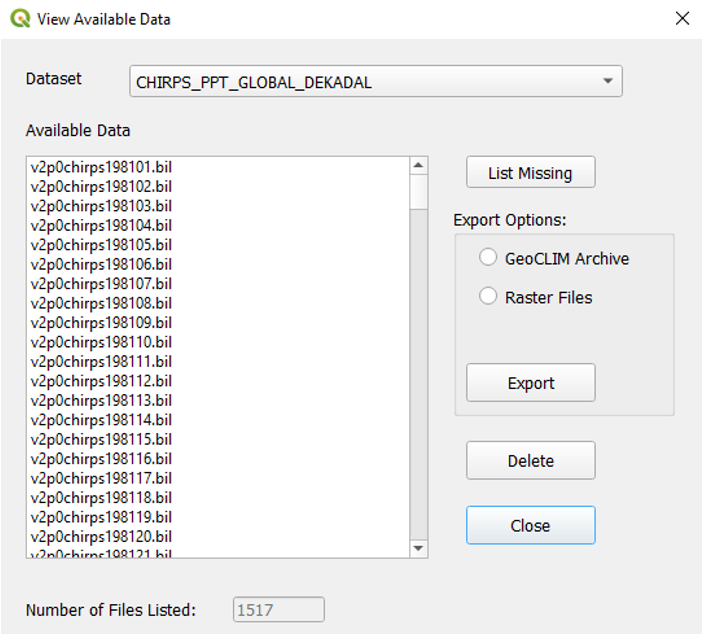
The View Available Data tool, Figure 1-7, provides a list of the data files available for the climate dataset selected (rainfall, mean temperature, minimum temperature, maximum temperature, or potential evapotranspiration). Figure 1-7 shows an example of a list of dekadal (+- 10-day) total rainfall starting on the first dekad of January 1981 (19810101). The List Missing Data button provides a list of any missing dates of the climate dataset selected between the first and the last date in the time series. You can export data, from the selected climate dataset to different formats (single *.bil or *.tif, *tiff files, or as an archive) for sharing or backup. See chapter 3 for more information on creating archives.
GeoCLIM Functions
1.8. Rainfall Climatological Analysis
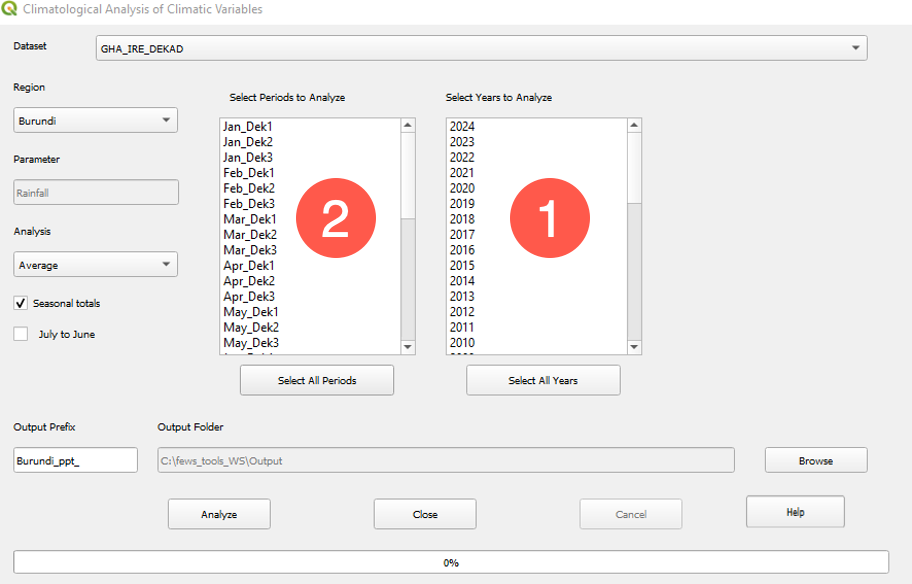
The Climatological Analysis of Climatic Variables tool, Figure 1-8, is designed to calculate and display the averages, trends, SPI, and other statistical characteristics of rainfall, evapotranspiration, and temperature data. The tool displays all the years (1) and periods (2) (months, dekads, or pentads) available for a selected climate dataset (see chapter 4 for a more in-depth discussion of this tool).
1.9. Rainfall Summaries
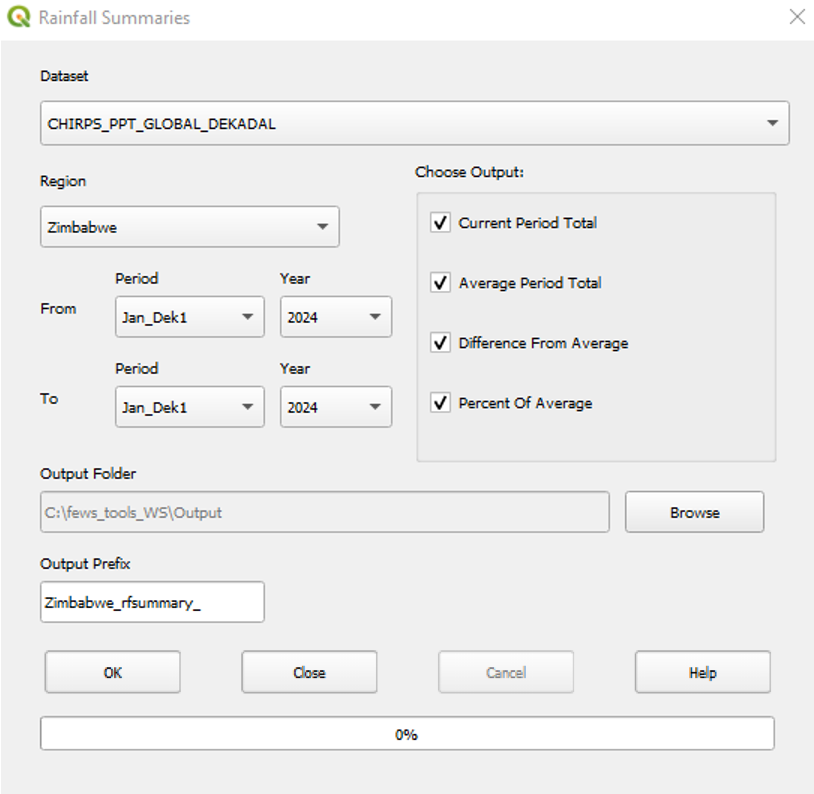
The Rainfall Summaries tool (Figure 1‑9) calculates the total rainfall, the long-term average, the difference, and the percent of the long-term average for a selected region and range of dates. More details on this tool are available in chapter 5.
1.10. Climate Composites
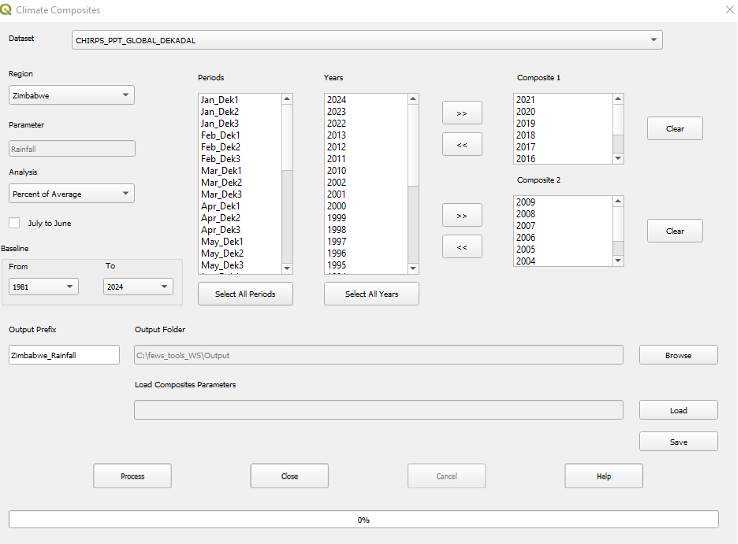
The Climate Composites tool facilitates the seasonal analysis for one or two groups of years. The tool calculates the seasonal average from a group of years, as well as comparing the seasonal rainfall performance between two groups of years, by calculating the percent of average, anomalies, and standardized anomalies (Figure 1‑10). See chapter 6 for more details.
1.11. Make Contours
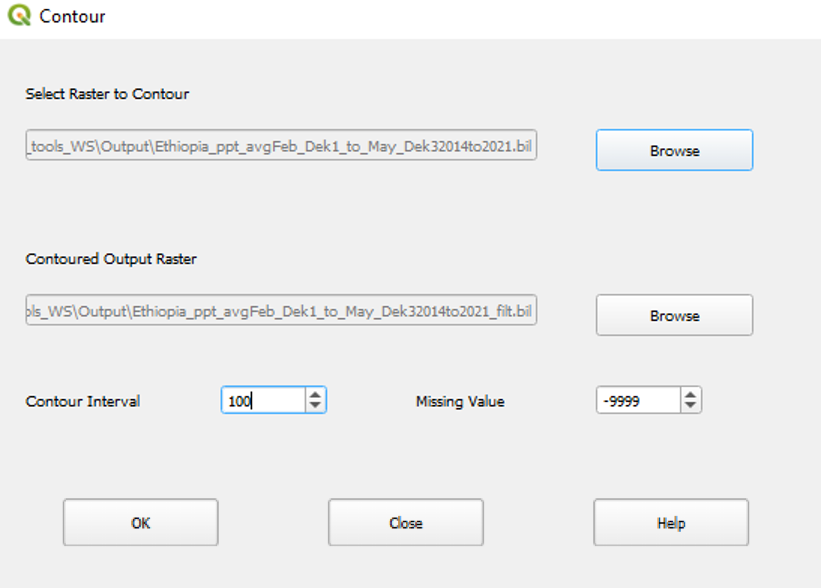
The Make Gridded Contours tool (Figure 1‑11) displays smoothed contours for a specified interval based on a raster (*.bil or *.tif, *tiff) file. This tool helps identify changes in rainfall patterns within a region of interest. Read more about making contours in chapter 7.
1.12. Climate Trends - Changes in Average
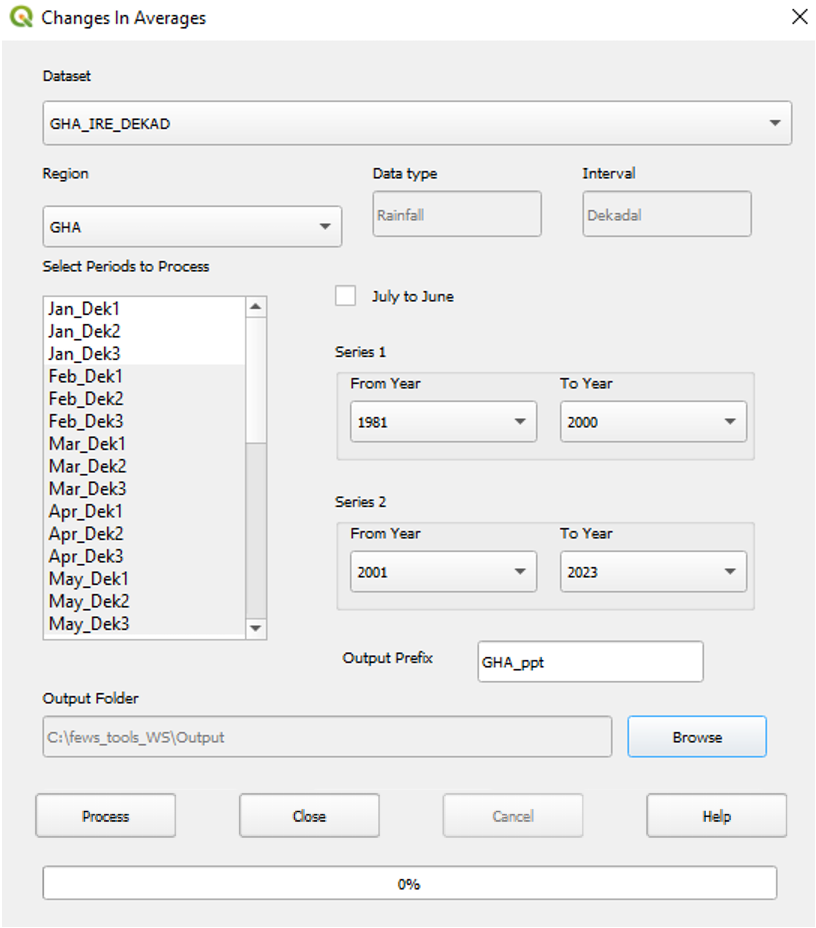
The Climate Trends - Changes in Averages tool (Figure 1‑12) identifies trends by calculating the difference in average between two periods (denoted as Series 1 and Series 2). See chapter 8 for more details.
1.13. Batch Assistant Tool
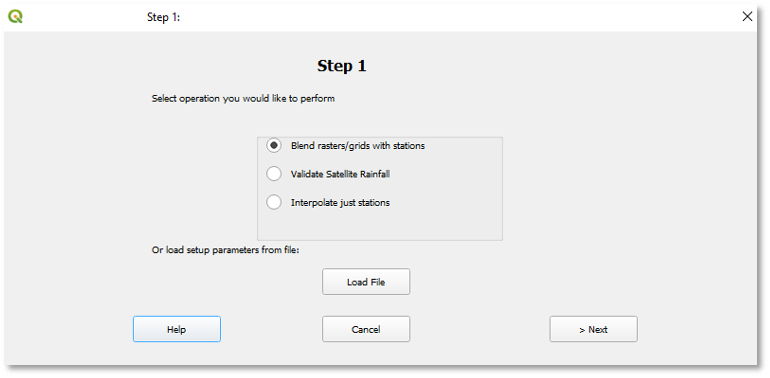
The Batch Assistant tool (Figure 1‑13) allows you to validate satellite-based data using climatological stations, blend climatological stations with raster data (BASIICS), and interpolate just stations. This section contains the following modules:
-
Blend rasters/grids with stations: This function blends raster (e.g., satellite data, etc.) with stations available for a specific period to create a new and improved climate dataset.
-
Validate Satellite Rainfall: Validates a raster dataset using station data by comparing the point-to-pixel value for each station.
-
Interpolate just stations: This function uses inverse distance weighting (IDW) process to interpolate station values. See chapter 9 for more information.
The function allows you to save the settings to run frequent processes, such as updating the time series every 10 days.
1.14. Extract Statistics from Raster Datasets
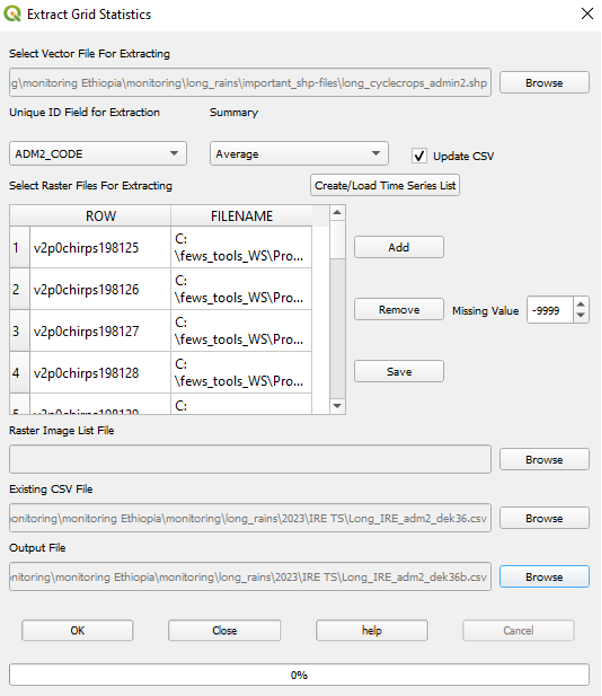
The Extract Grid Statistics tool summarizes raster information by zones defined in a vector file (polygons such as districts, provinces, watersheds, etc.). This tool produces a table with one of the summary statistics by polygon (sum, maximum, minimum, range, or standard deviation). This extraction can be applied to a single or a set of climate raster files defined in the time series option (Figure 1‑14). For more on this tool, see chapter 10.
GeoWRSI Analysis Functions
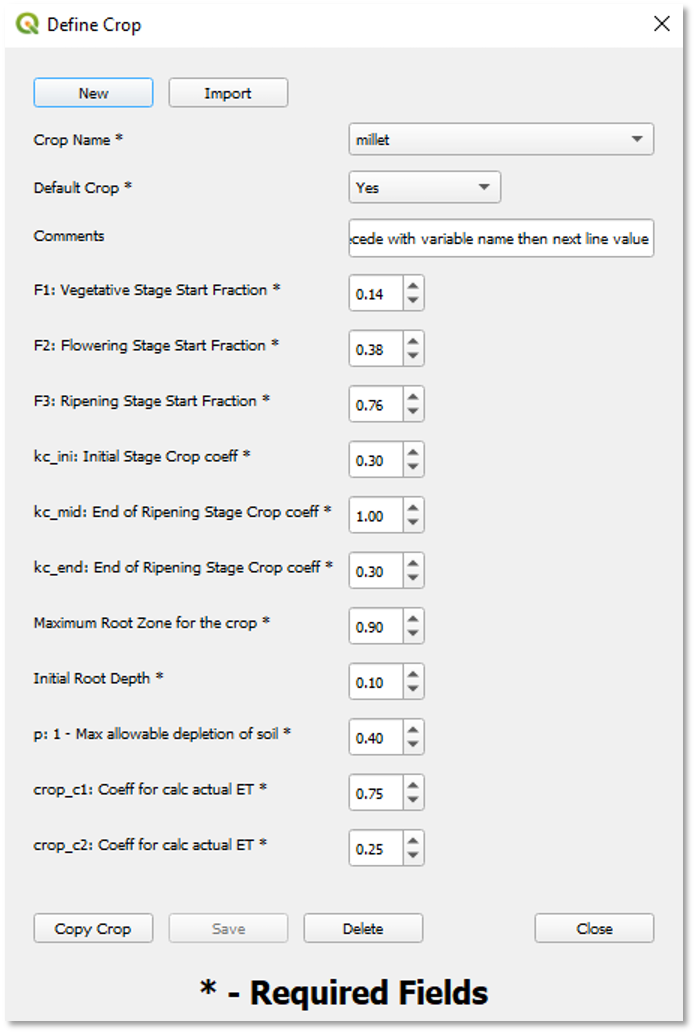
1.15. Add/Edit Crops
This section explains the GeoWRSI crop parameters that are used as inputs to the model. You can change these parameters to create new crops that the GeoWRSI can run, but this should be done with sufficient theoretical and agronomic background. See Figure 1-15.
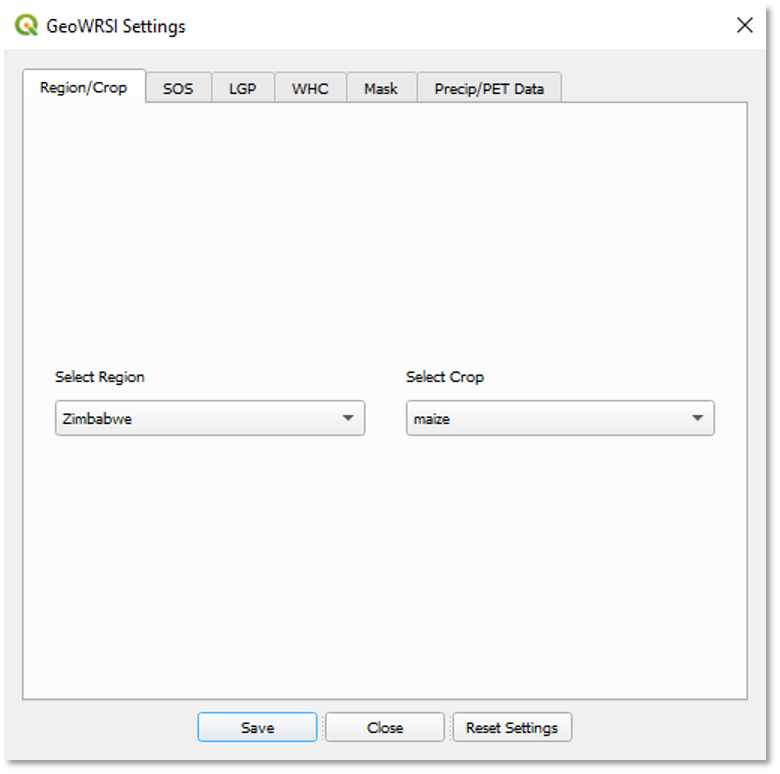
1.16. WRSI Settings
This section allows you to select the region and crop to be analyzed, the method for calculating the start of the season, the length of growing period, the water holding capacity (WHC) file, define or create a mask file, and select the precipitation and potential evapotranspiration. See Figure 1-16.
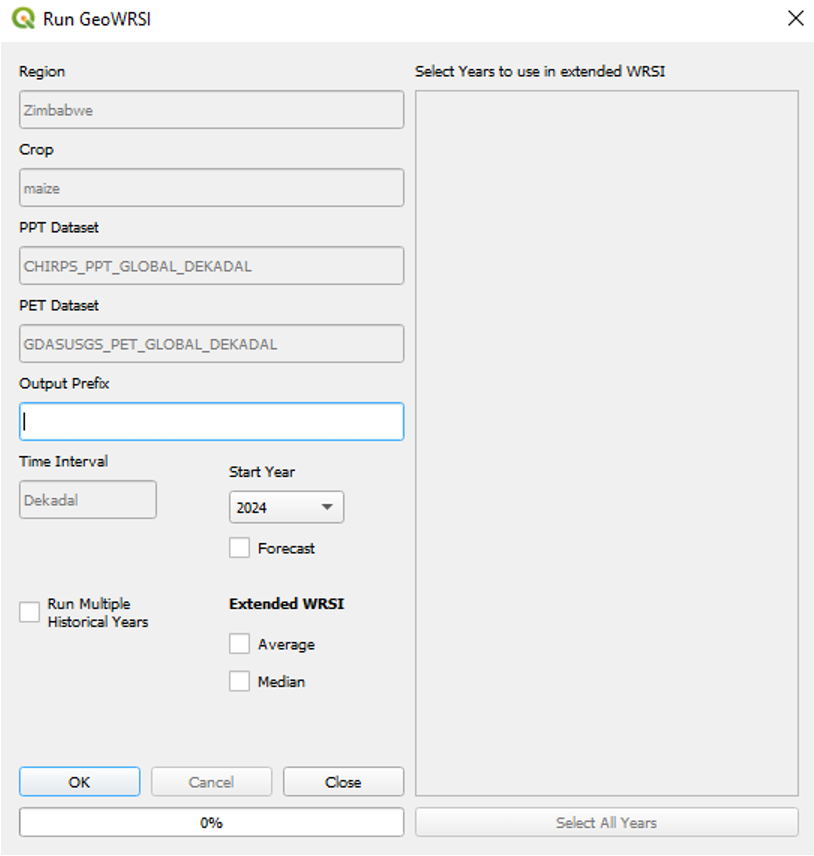
1.17. Run GeoWRSI
This function brings the settings saved on the previous section and allows to select the year or years for which to run WRSI. See Figure 1-17.
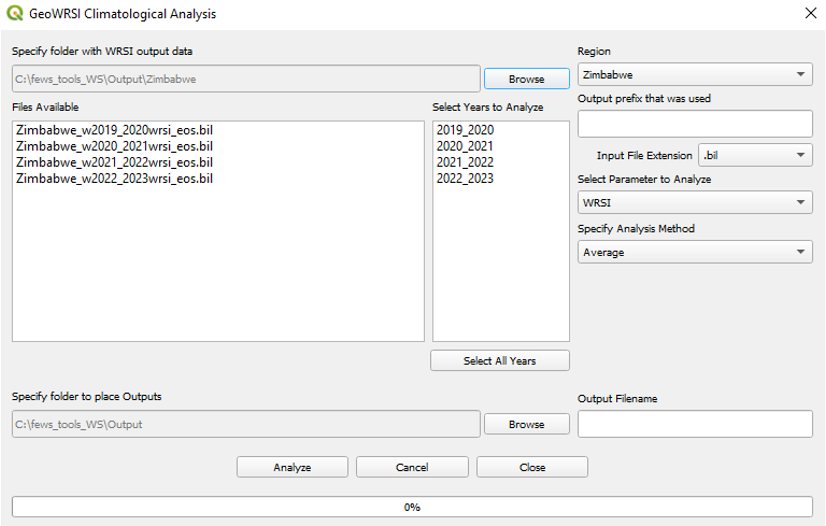
1.18. Climatological WRSI/SOS Analysis
This function allows you to calculate average end of season WRSI or average start of season, based on the number of years available. See Figure 1-18.
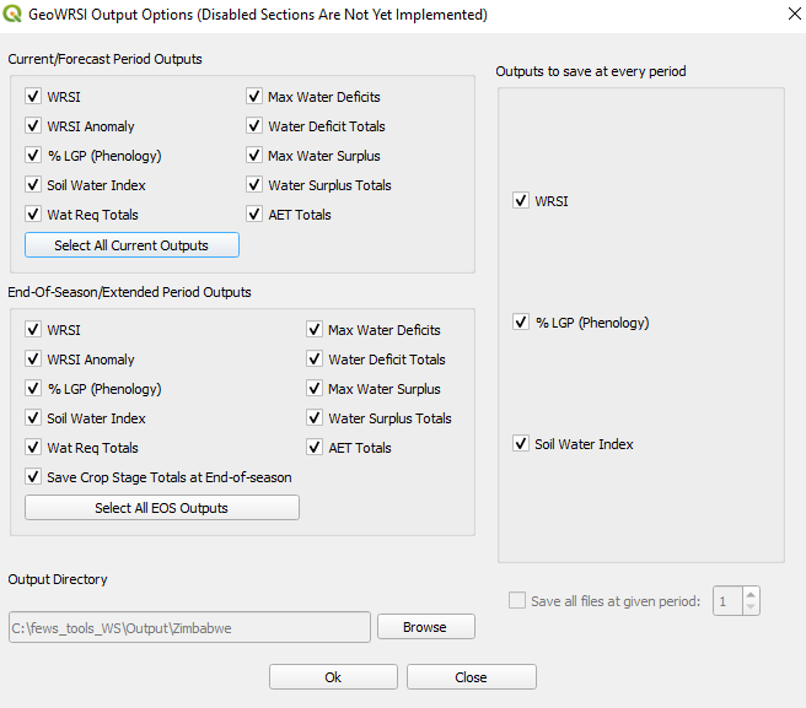
1.19. WRSI Output Settings
The GeoWRSI tool allows you to set the outputs that the tool will produce, as well as the directory where all the products will be saved. See Figure 1-19.