Usage
General
Use alternating bands in tables to improve readability. See specifications.
Avoid featuring missing data. To the extent possible, try to use charts that include data for all the locations included in the scope of the chart.
Choose a meaningful timeframe that isn’t arbitrary. To the extent possible, when selecting a timeframe for a chart, choose one that best illustrates the key message or trend you want to highlight.
Use brand styles. In general, use Segoe UI or Open Sans for all text throughout the chart. Pay attention to font weight (for example, use Semibold for titles) and colors.
Do not include descriptive text or text boxes. The footer may be used to include footnotes with clarifications or additional explanation that need to accompany the visualization. If the visualization appears in context of narrative text, consider including a note in the surrounding text instead of in the visualization itself.
Axes
Ensure legibility. Choose a readable font size and color contrast for axis labels and numbers. Ensure that even those with visual impairments can clearly read the chart.
Keep it simple. Keep the axis design simple and avoid unnecessary design elements that don't add to the interpretation of the data.
Use descriptive labels. Always label both the x-axis (horizontal) and y-axis (vertical) with clear, concise descriptions of what the data represents. If the x-axis includes a time scale, no axis label is needed.
Different time scales. When showing data from different time scales, it should be easily distinguishable.
Include units. Specify the unit of measurement in the axis label (e.g., percentage, currency, time) to avoid ambiguity.
Know when to use linear vs. logarithmic scales. Use a linear scale when values increase at a steady rate, and a logarithmic scale for values that grow exponentially. Make sure the scale fits the nature of your data.
Start at zero. As much as possible, it is strongly recommended to begin the x-axis and y-axis at zero to avoid distorting the data.
Rotate labels if needed. For long or densely packed labels, consider rotating them (especially on the x-axis) to 40° angles to prevent overlap. Consider reducing tick marks or shortening labels rather than packing labels.
Use subtle gridlines. Use light, subtle gridlines to help align data points to the axes without distracting from the main chart. Keep them muted (e.g., light grey) so they don't overpower the data.
Place labels appropriately. Ensure that axis labels are placed close to their respective axes for easy reference without interfering with the data.
Follow brand guidance for dates. If space permits, use the format Month YYYY. Otherwise, abbreviate to MMM YYYY (ex. Mar 2025 or Sept 2021). For a time series spanning multiple years, you might label the x-axis like: Jan 2023 | Jul 2023 | Jan 2024 | Jul 2024 | Jan 2025. See Dates.
Use consistent number formatting. If you're using decimal points, ensure consistency throughout the axis. Avoid mixing formats like "0.5" and "5,000" without explanation. If using currency, format consistently as "$1M, $2M, $3M" instead of mixing "$1,000,000" and "$2M."
Format large numbers succinctly. Use abbreviations for large numbers (e.g., "K" for thousands, "M" for millions) to avoid overcrowded labels. Use "10K" instead of "10,000."
Don’t crowd ticks and labels. Too many tick marks or labels can clutter the chart. Use fewer ticks or round numbers to make the axis easy to read.
Don’t use arbitrary time intervals. For time series data, use regular intervals (e.g., every month, year, or quarter) to maintain clarity.
Don’t disproportionately scale the chart. The aspect ratio of the chart should not distort the data. Stretching or compressing the axes can exaggerate trends. Use a consistent ratio to reflect the true relationship between variables.
Colors
Confirm 508 compliance. Ensure that colors have sufficient color contrast to meet 508 compliance standards. Section 508 a federal law that requires federal agencies to make their communication accessible to people with disabilities. Meeting the color contrast requirement ensures the visual presentation of text and images of text has a contrast ratio of at least 4.5:1. Tools such as webaim.org are helpful for checking color contrast. See Color safety and recommended combinations.
Use shapes and patterns. Instead of just colors, consider using shapes or patterns to differentiate items, especially for colorblind accessibility.
Don’t use similar shades of color. Avoid using shades of the same color that are too difficult to distinguish
Avoid using more than 6 data colors per chart. Consider using symbols, dashed lines, and other techniques rather than using more colors than needed.
Components
-
Chart content frame
-
Lines
-
Bars
-
-
Axis titles
-
Y-axis labels
-
Text
-
Tick
-
-
X-axis labels
-
Text
-
Padding and spacing
-
Chart body fills full width of the visualization frame
-
Chart body height is fixed to the minimum height necessary to clearly convey the relevant data
-
0px top
-
8px bottom
-
16px when x-axis title is present
-
-
52px right side
-
16px when y-axis title is present
-
-
16px left side
-
16px horizontal between y-axis title(s) and y-axis labels
-
2px horizontal between y-axis label and tick
-
13px horizontal padding between left- and right-most x-axis labels and y-axes
-
8px vertical between x-axis and x-axis labels
-
24px between x-axis labels and x-axis title, when present
-
60px minimum vertical space between y-axis labels
Layout and responsiveness
-
Chart content frame width and height fills full space available
-
Y-axis titles are vertically centered to y-axis
-
X-axis title is horizontally centered to x-axis, when present
-
Equal vertical space between each y-axis label
-
Equal horizontal space to the left and right of each x-axis label
-
Left-side y-axis label text hugs right, right side text hugs left
-
Y-axis label text is vertically centered to y-axis tick, including bottom “0” label and top label
-
Chart content frame scales down horizontally as width decreases until 609px width is reached, after which width and height scale down proportionally.
-
Note axis titles and labels remain the same size
-
Fills
Chart content background
Every chart should have rows of alternating colors to delineate divisions of y-axis values. Colors should alternate between Brand White (#FFFFFF) and Gray 150 (#FAFAFA).
Data
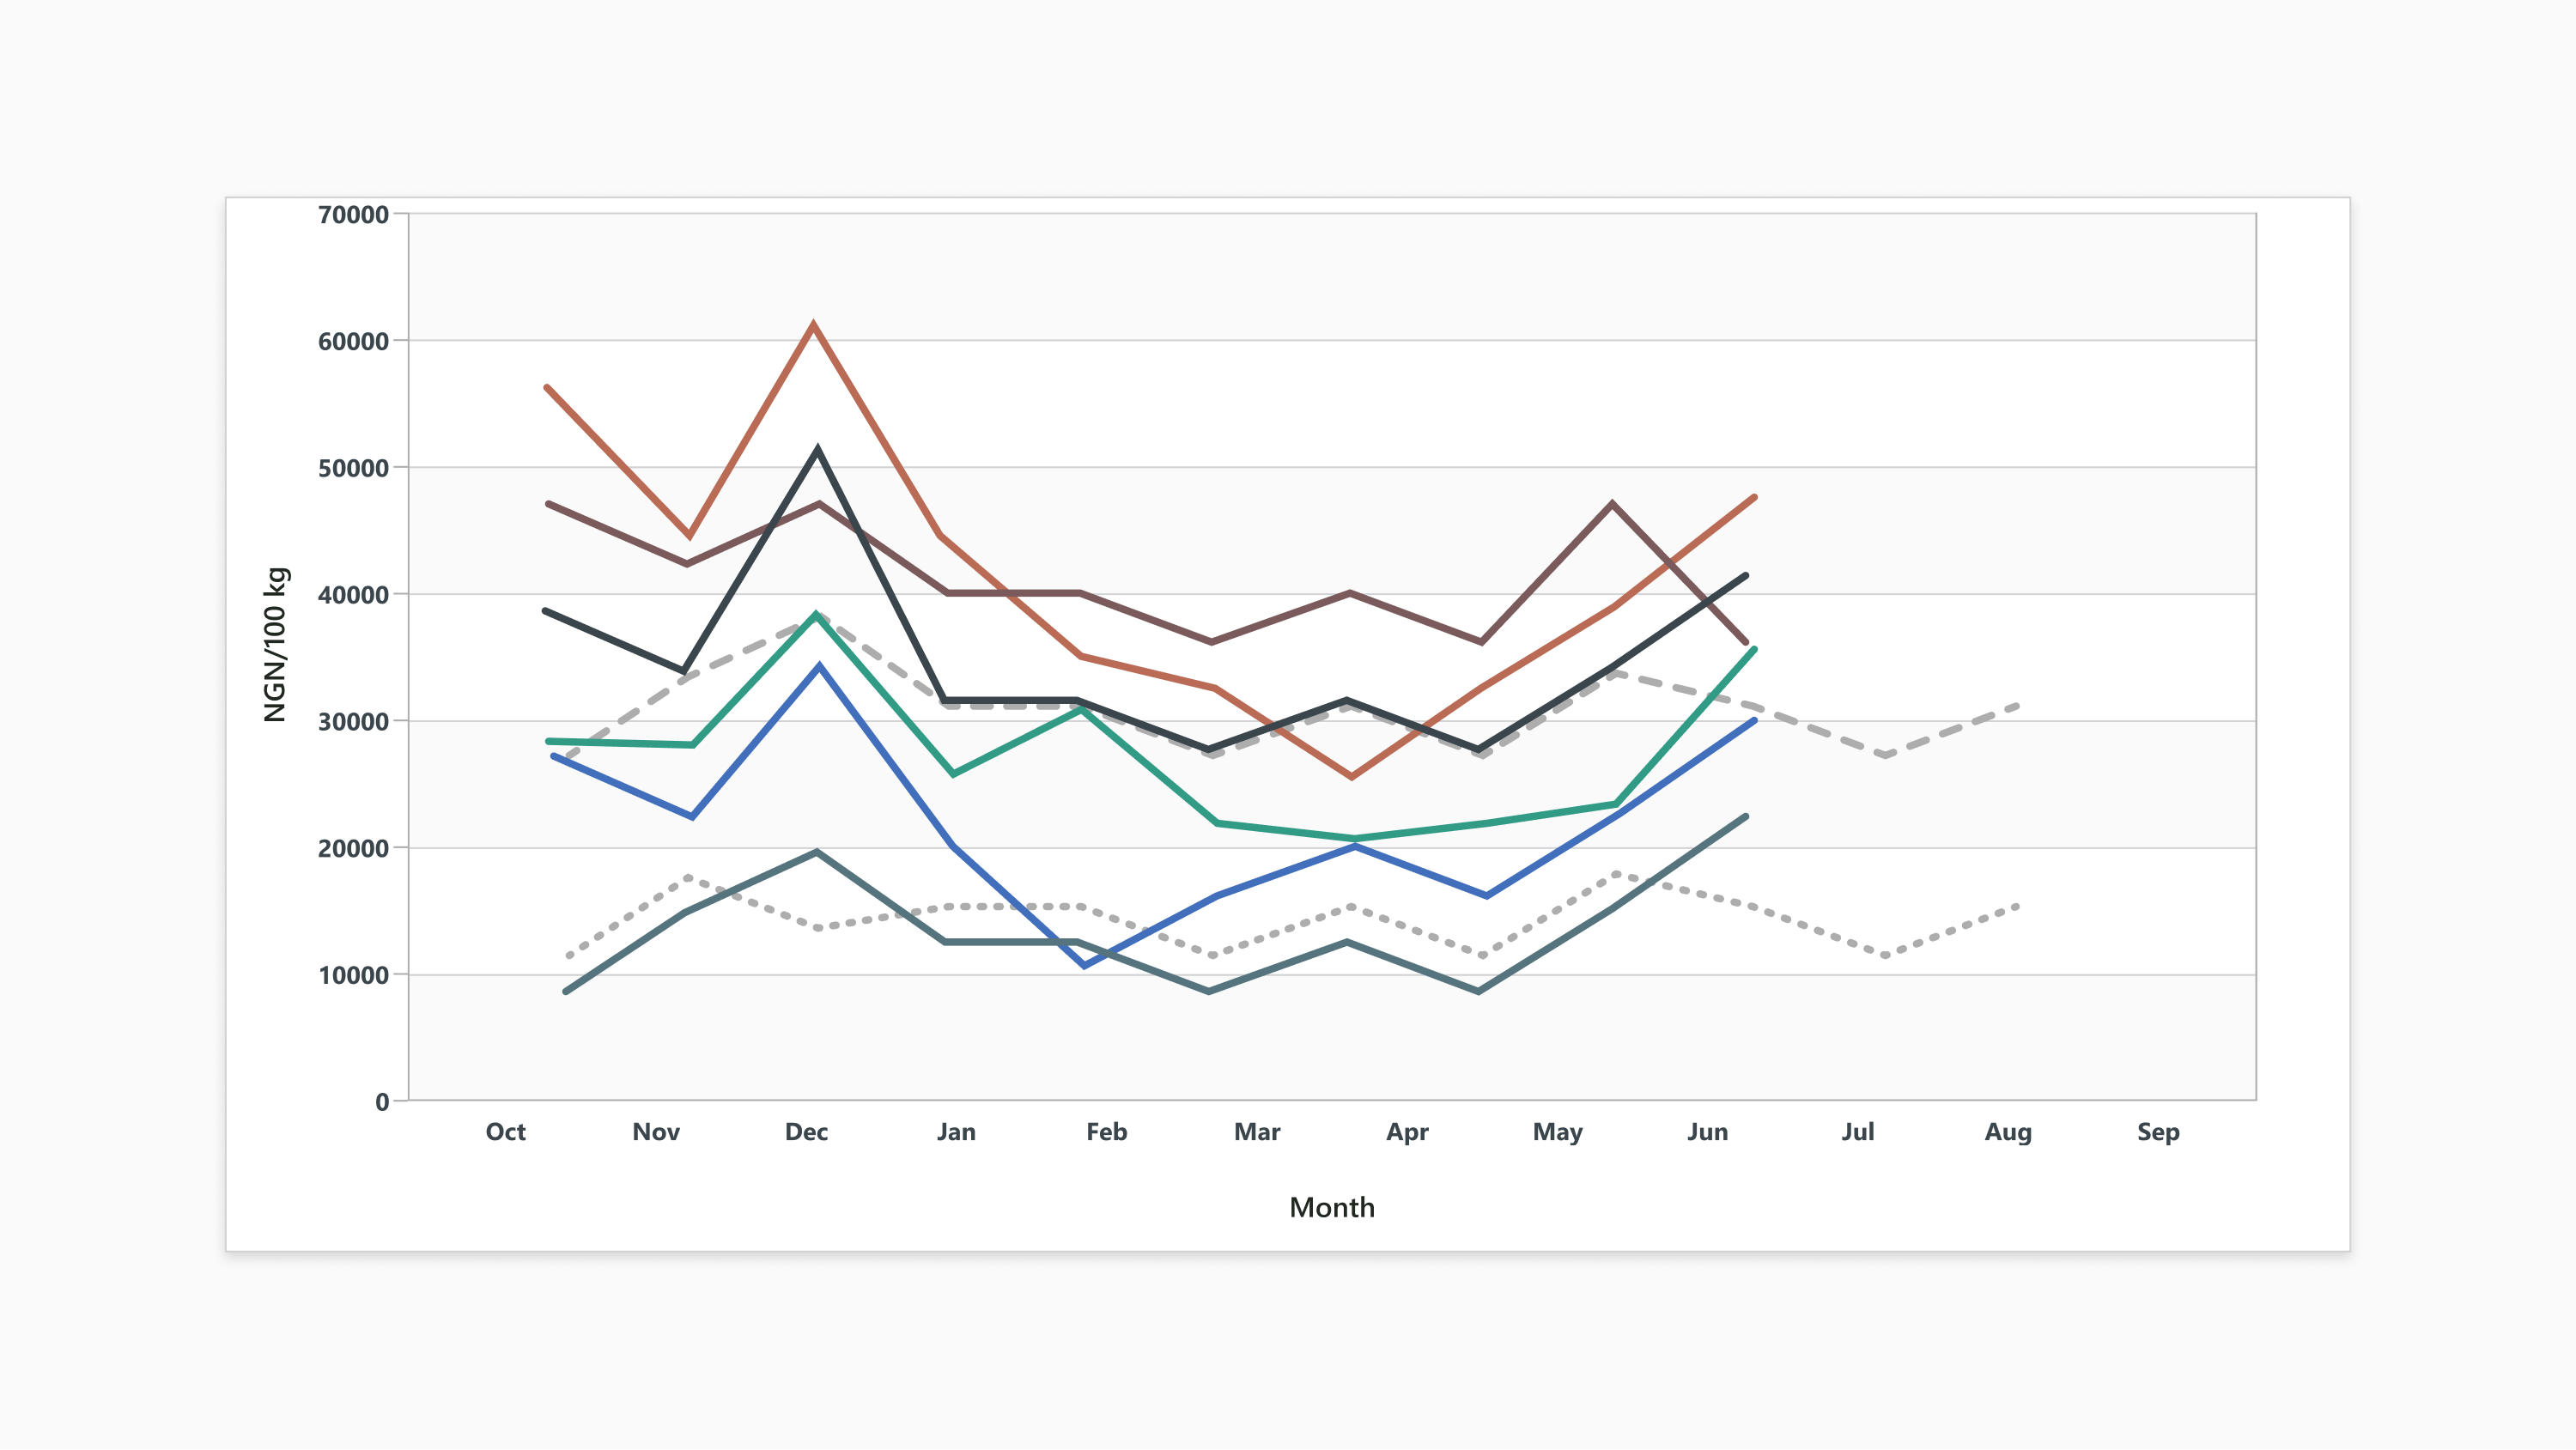
When representing data series using lines or bars, use colors in the following order. These colors were chosen to ensure the best possible contrast for 6 lines against each other and a White/Gray 150 fill.
Charts should not contain more than 6 line/bar colors. 10 additional colors are included in the sequence for rare cases where more than 6 colors are needed.
There are additional specifications for charts in livelihoods products (staff only).
|
Order |
Color style name |
Hex value |
RGB value |
|---|---|---|---|
|
1 |
|
#426FBC |
66, 111, 188 |
|
2 |
|
#319B86 |
49, 155, 134 |
|
3 |
|
#3A454C |
58, 69, 76 |
|
4 |
|
#BA6B55 |
186, 107, 85 |
|
5 |
|
#7A5A5A |
122, 90, 90 |
|
6 |
|
#55747E |
85, 116, 126 |
|
7 |
|
#707257 |
112, 114, 87 |
|
8 |
|
#A173B3 |
161, 115, 179 |
|
9 |
|
#305088 |
48, 80, 136 |
|
10 |
|
#107157 |
16, 113, 87 |
|
11 |
|
#555E62 |
85, 94, 98 |
|
12 |
|
#B95A38 |
185, 90, 56 |
|
13 |
|
#6D4140 |
109, 65, 64 |
|
14 |
|
#6A8188 |
106, 129, 136 |
|
15 |
|
#60613A |
96, 97, 58 |
|
16 |
|
#784595 |
120, 69, 149 |


Lines
|
Type |
Thickness |
Color |
Additional Specifications |
|---|---|---|---|
|
Axis |
1px (1pt) |
Gray 500 (#ADADAD) |
|
|
Y-axis tick (left of axis) |
1px (1pt) |
Gray 500 (#ADADAD) |
|
|
Y-axis tick (right of axis) |
1px (1pt) |
Gray 400 (#D1D3D4) |
|
|
Line (Data) |
4px (3pt) |
See Fills > Data |
|
Typography
FEWS NET visualizations use the Segoe UI typeface unless specified otherwise. Use Open Sans if Segoe UI is not available.
|
Style name |
Font |
Line height |
Color |
Additional specifications |
|---|---|---|---|---|
|
Axis title |
16px (12pt) Semibold |
120% |
Brand Black Dark (#090B09) |
|
|
Axis label |
14px (10.5pt) Bold |
120% |
Brand Black Dark (#090B09) |
|
Contact us if you have an application question or recommended addition to these standards.