This short guide covers the basics of using the FEWS NET Data Explorer (FDE). Scroll through the guide for a full review of the system, or use the menu on the right to skip to a specific topic.
About the FEWS NET Data Explorer
The FEWS NET Data Platform acts as the central storage location and access portal for data used by FEWS NET for food security and early warning analysis. The Platform is made up of two primary sub-components:
-
The Data Explorer (focused on data access)
-
The Data Warehouse (focused on data storage)
This guide focuses on use of the FEWS NET Data Explorer (FDE).
The primary purpose of the FDE is to provide you with easy access to data in the Data Platform. To accomplish this, data is categorized by industry and can be searched and filtered. You can explore and validate potentially relevant data using a combination of visualization tools such as tables, graphs, and maps before exporting it for use.
Note that the FDE does not provide access to all of the data FEWS NET holds. Some data has restricted permissions and some data can only be accessed by using the FEWS NET Data Platform API.
The FEWS NET Data Platform is designed to work with data from humanitarian sector components including:
-
Population and demographic
-
Relief needs estimates and actual deliveries
-
Market prices
-
Agricultural production
-
Nutrition
-
Cross border trade
-
Livelihoods
The Data Explorer has three main types of functionality:
-
Data Sources: Search for and view Data Collections and their associated assets.
-
Explore Data: Browse and download Data Points.
-
Visualizations: View and create interactive Visualizations using data stored in the FDW.
About Topics
Within the FEWS NET Data Explorer (FDE), humanitarian sector components are represented as Topics containing one or more subtopics. A subtopic is a grouping of data that contains a collection of data series. Topics and subtopics are organized to unify and consolidate data based on metadata consistencies and sector relationships. For example, data on relief needs estimates and actual deliveries are included within the Responses topic.
Some topics have limited visibility and may not be included in your view.
To request access to non-public data, submit a Help Desk form with information about the purpose of your analysis, why you need access specifically to this data, and your organizational affiliation. Your request will be reviewed internally to determine if additional permissions can be granted. Note that much of the data in the FEWS NET Data Warehouse is provided by third parties. Access to this data is subject to the licenses and conditions established by the original source organization.
|
Topic |
Description of data |
|---|---|
|
Food Security Classification |
Includes various data related to food security such as:
This data is compatible with the Integrated Phase Classification (IPC) system with limited exceptions. In rare cases, FEWS NET classification is IPC-aligned but not IPC-compatible. IPC-aligned analysis is evidence-based but some types of evidence required for IPC-compatibility were not available. |
|
Spatial |
Geographic admin boundary information along with shapefiles, population estimates, and demography estimates, including male/female and age/gender breakdowns |
|
Markets and Trade |
Includes a variety of data related to markets and trade such as:
|
|
Crop Production |
Crop cultivation and harvest attributes (e.g., area harvested, planted, quantity produced, yield) |
|
Agroclimatology |
Data related to normal and extreme weather such as heat and rainfall |
|
Nutrition |
Health and nutrition indicator information (e.g., mortality rate, disease prevalence, death rate) |
|
Emergency Responses |
Cost and quantity of interventions in a given geographic area by various operators, including aid agencies |
|
Population and Demography |
Includes a variety of data related to markets and trade such as:
|
Data Sources
The Data Sources page is the easiest location to search for and view the Data Collections and assets associated with a Data Source. Note that this screen only contains a broad overview of Data Points associated with a Data Source. To browse and download Data Points, click on Explore Data.
Data Sources can be searched by name or filtered by:
-
Topic: Topics are broad grouping of data organized to unify and consolidate data based on metadata consistencies and sector relationships.
-
Organization: The organization that provides and manages the data.
-
Country: The country about which the data was collected.
-
File format: The format of any available assets.
Learn more about searching within the Data Explorer.
Note that a Data Source is not equivalent to an organization. Organizations may have multiple Data Sources. For example, an organization might have nutrition surveys from multiple years where each year’s survey is a separate Data Source. Or, an organization might have different Data Sources for different types of data (e.g. price and exchange rates).
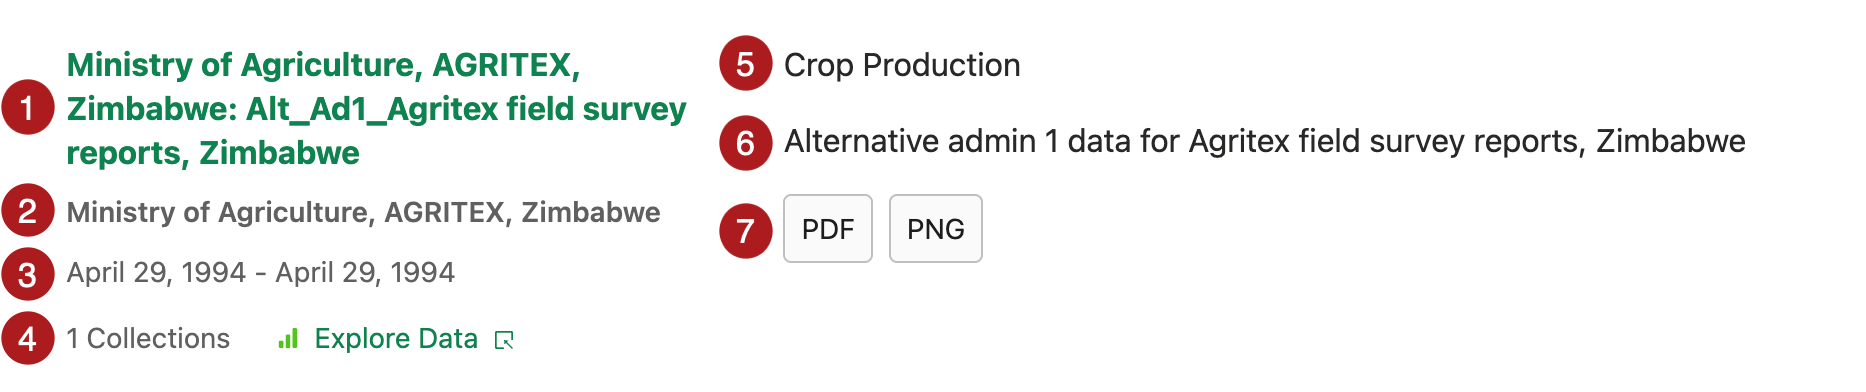
On the Data Sources main page you can view summary information about each Data Source including:
-
Data Source name
-
The name of the associated organization
-
The date range of the data
-
The number of Data Collections associated with that Data Source
-
The type of data available
-
A description of the data
-
The file types available as associated assets (if applicable)
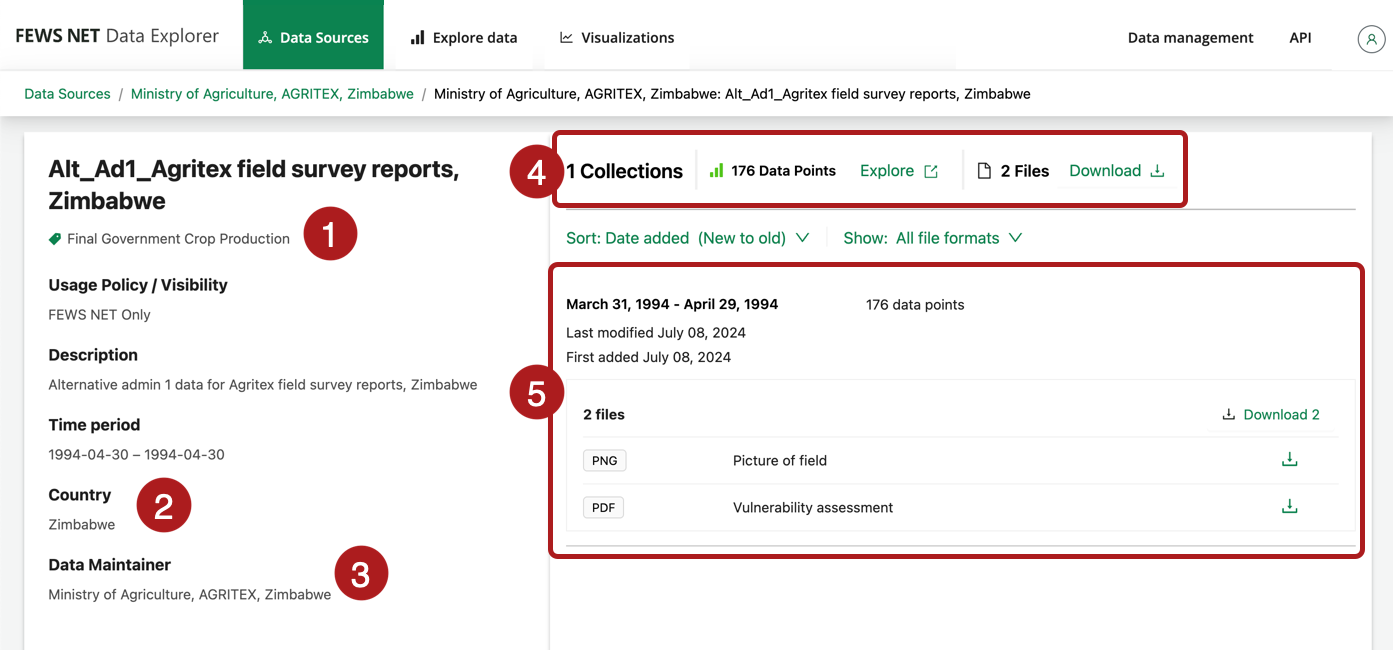
Once you choose a Data Source, you can view additional information including:
-
Tags
-
Country
-
Who maintains the data
-
The total number of Data Points and/or files associated with that Data Source
-
Details about each Data Collection
-
The number of Data Points and/or files in the Data Collection
-
The date range of the data associated with that Data Collection
-
When the Data Collection was last modified
-
When the Data Collection was first added to the Data Platform
-
You can also perform the following actions on a Data Source screen:
-
Download asset files individually or in bulk, if available
-
Jump to the Explore Data screen to explore data and download Data Points
Explore Data
To explore data within the FDE, you need to do one of the following:
-
In the Explore Data tab, choose a topic.
-
In the Data Sources tab, select the Explore Data button from any Data Source that contains Data Points. Sources labeled as Asset Only do not contain Data Points.
Some topics have limited visibility and may not be included in your view.
To request access to non-public data, submit a Help Desk form with information about the purpose of your analysis, why you need access specifically to this data, and your organizational affiliation. Your request will be reviewed internally to determine if additional permissions can be granted. Note that much of the data in the FEWS NET Data Warehouse is provided by third parties. Access to this data is subject to the licenses and conditions established by the original source organization.
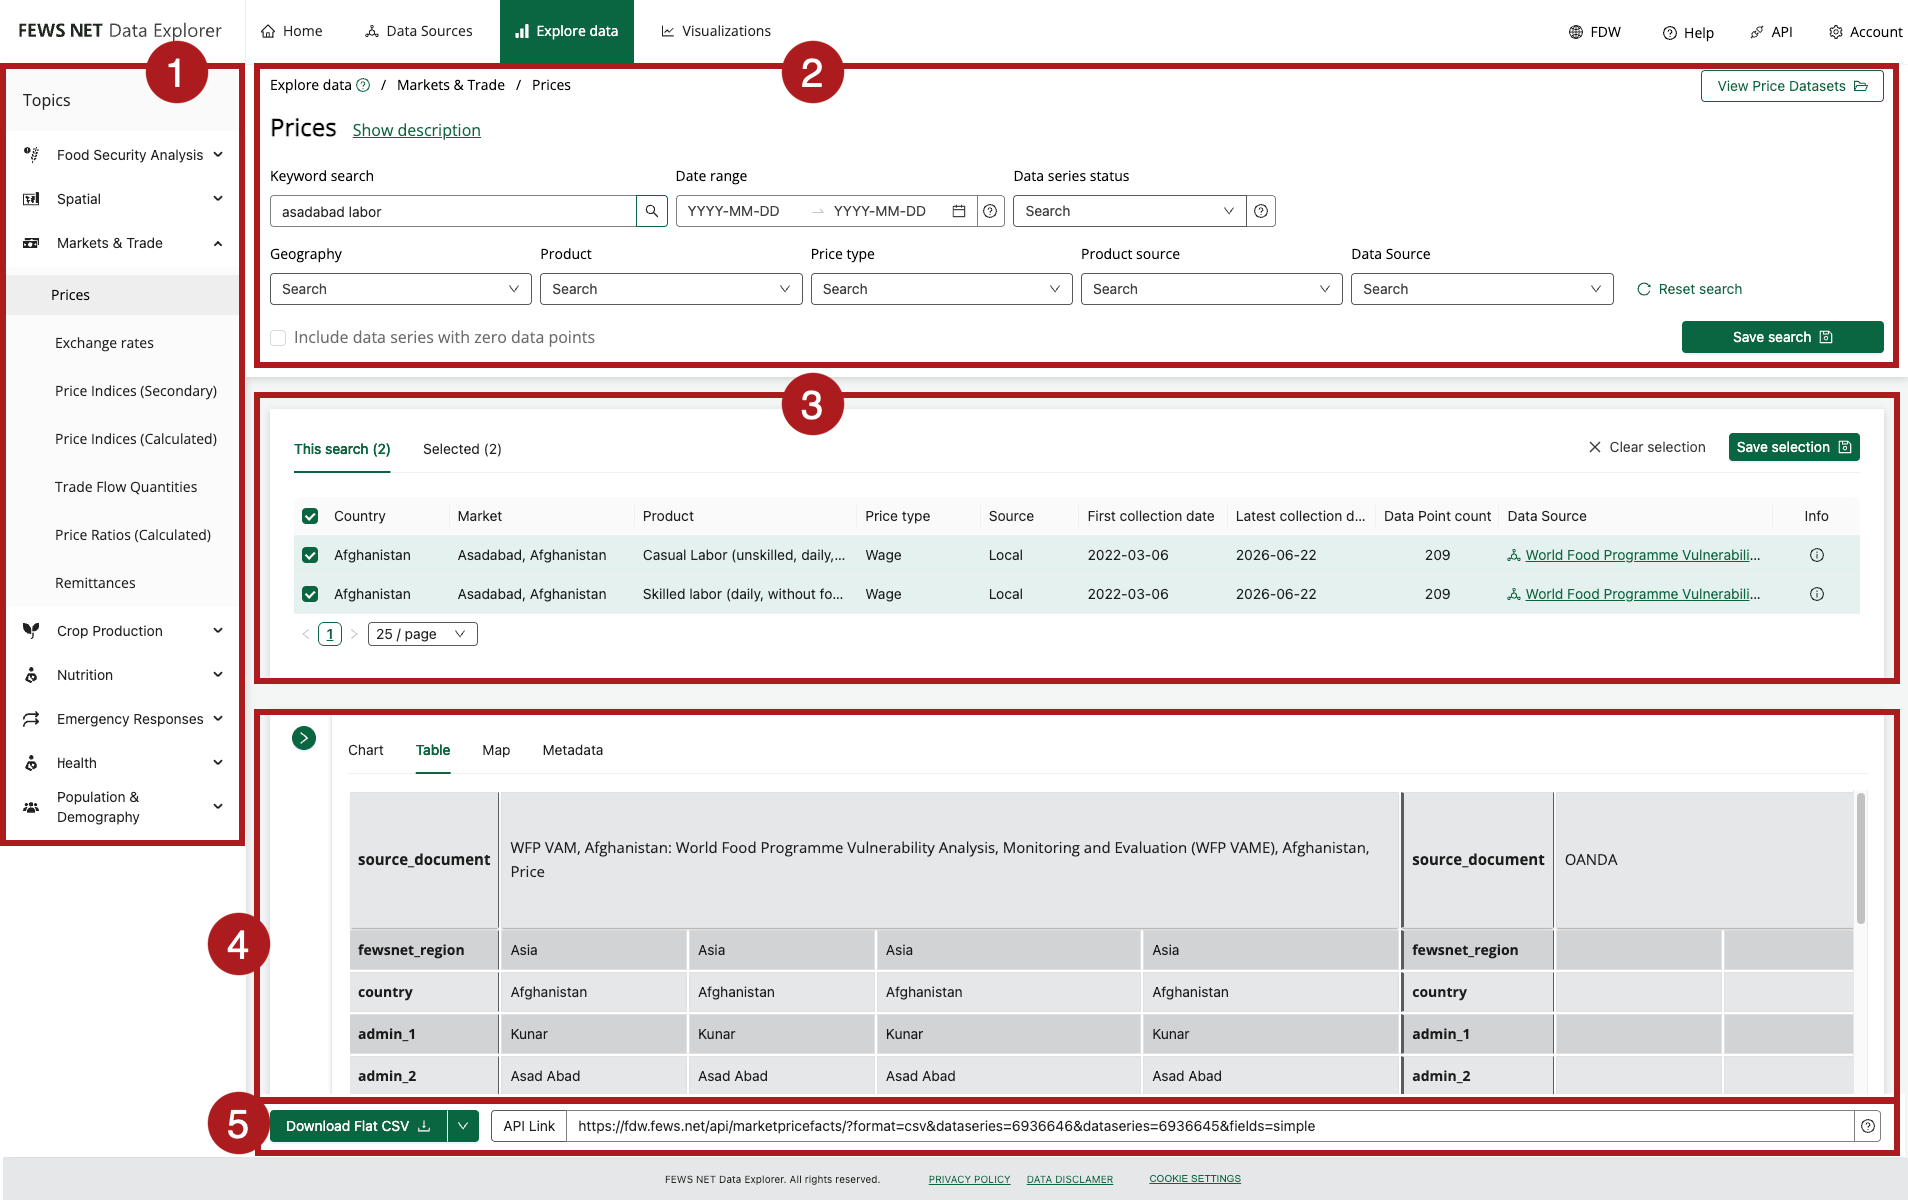
Explore data pages are structured as illustrated below:
-
Select a topic: The topic selection bar is always available. Learn more about topics in FDE.
-
Search and filter: Learn more about searching and filtering in the FDE.
-
Select data: Learn more about creating and saving datasets.
-
Customize and preview data: Learn more about customizing and previewing data.
-
Export data: The export toolbar allows for file download and copying of the API link. It remains perpetually at the bottom of the screen so you can easily download selections and see how your choices impact the API URL. Learn more about exporting data.
Video: Explore Data use case
Watch the below video for an example of accessing market prices for red sorghum in Somalia over time (02:18, includes closed captions).
Visualizations
The Visualizations section allows you to view Visualizations and Dashboards, access Data Discovery Tools, and build and save Visualizations.
The Visualizations functionality is divided into the following tabs:
Search all: Search and view Visualizations, Data Discovery Tools, and Visualization Dashboards.
Favorites: View Visualizations that you have favorited.
Owned by me: View Visualizations that you have built and saved.
Builder: Search and select a Visualization template to build a Visualization. Learn more about building Visualizations.
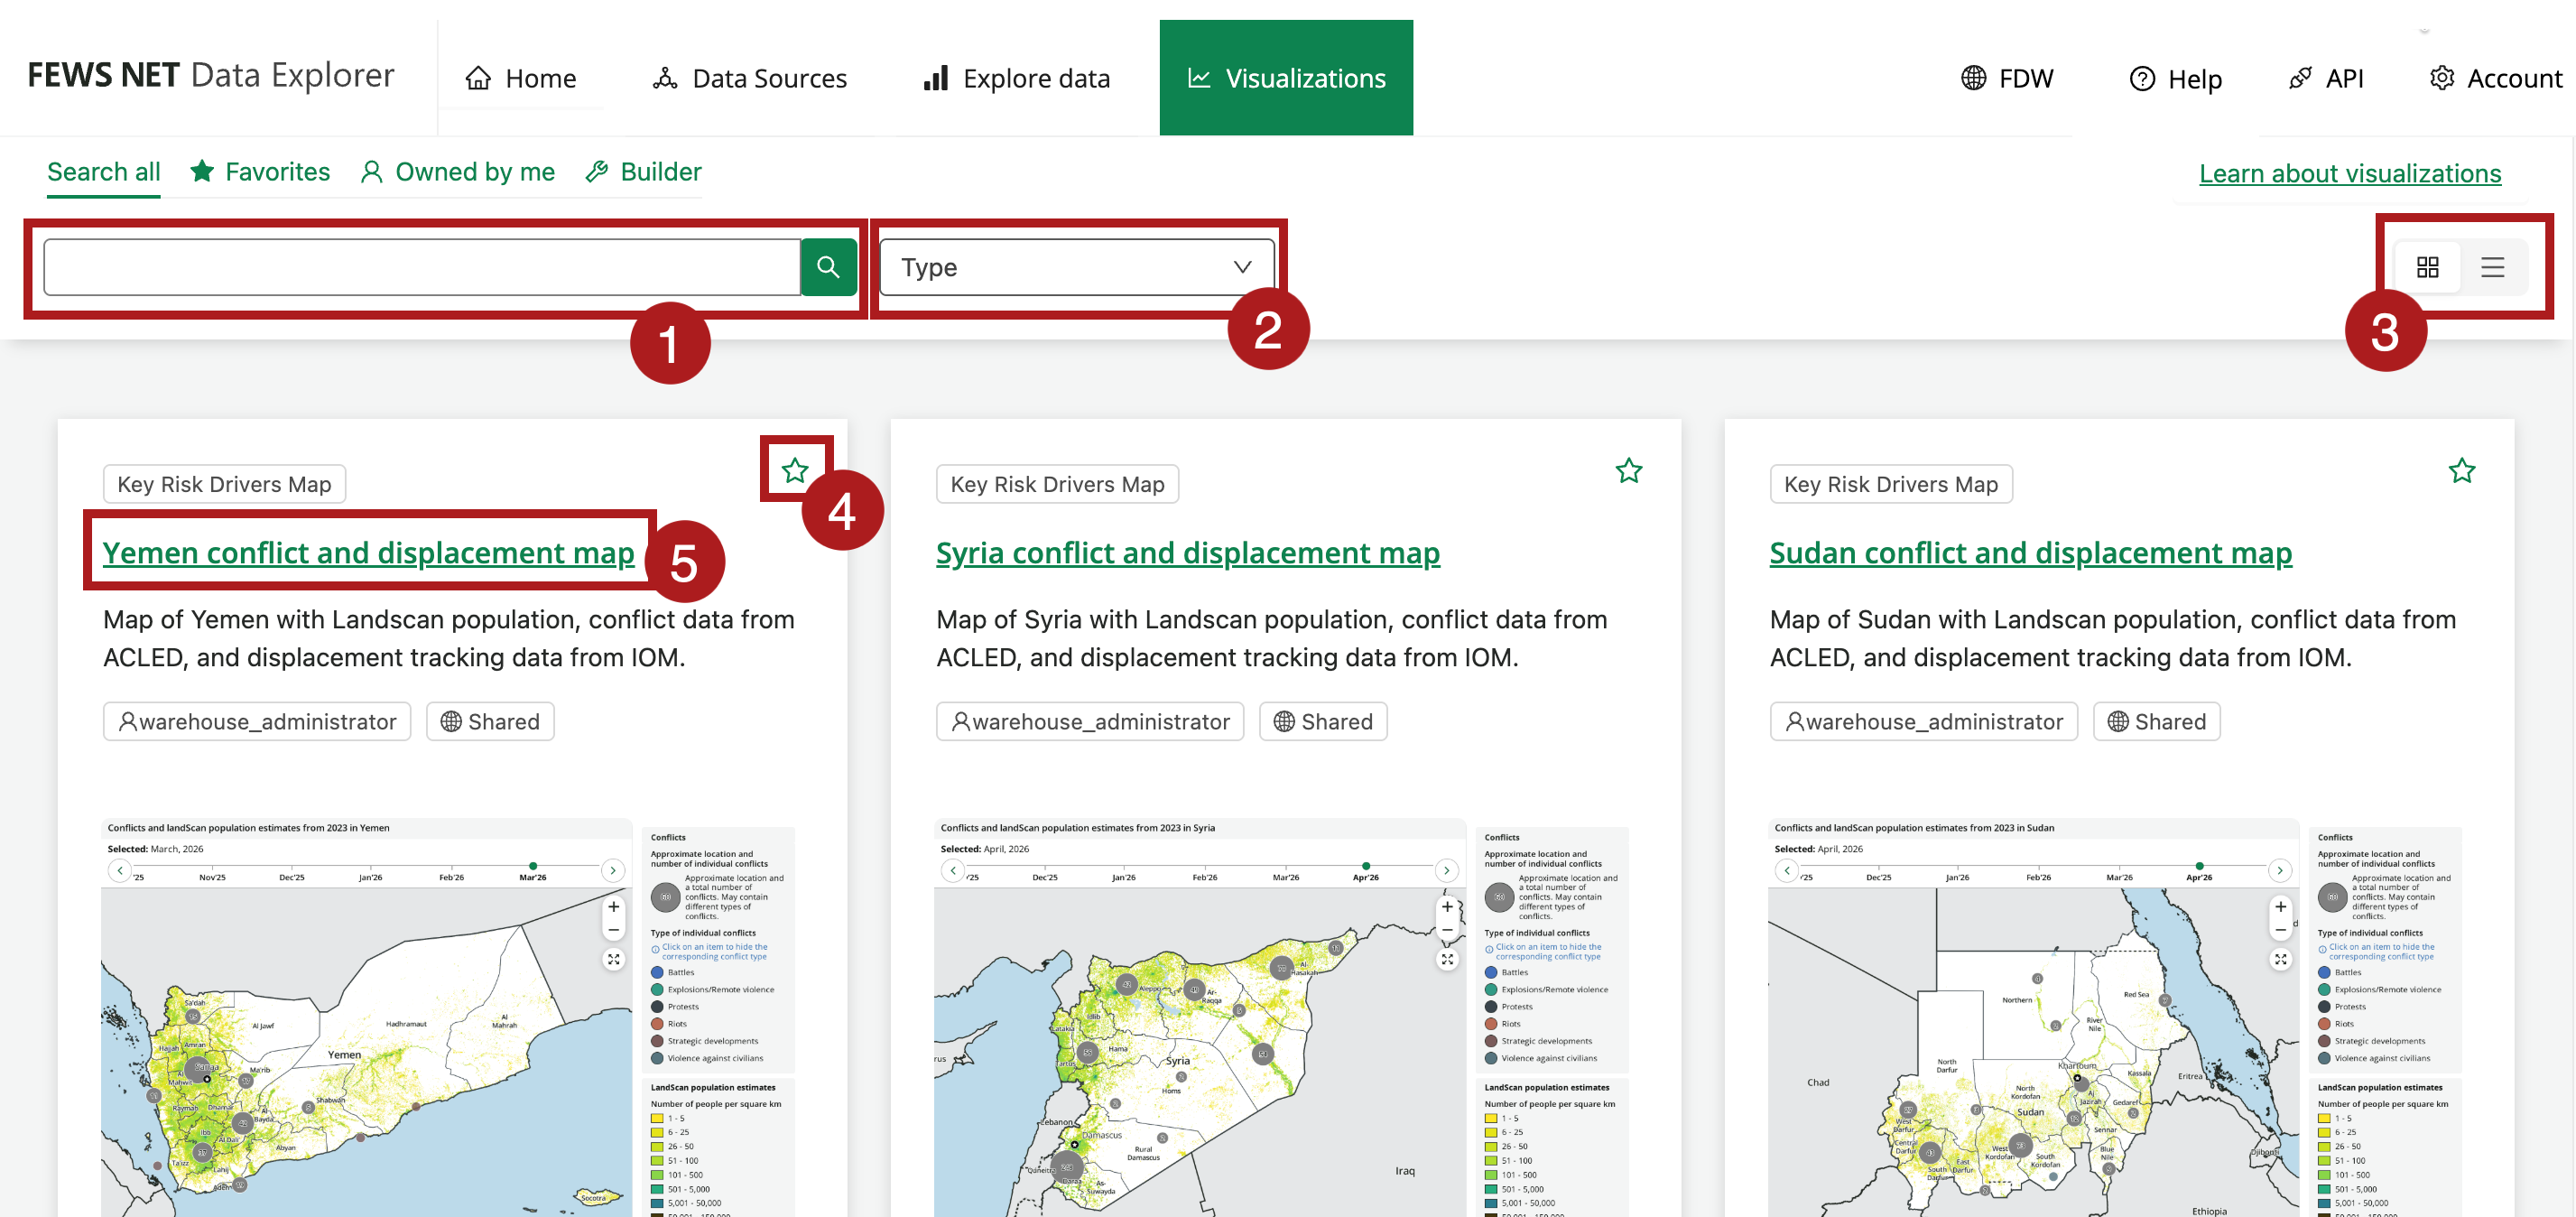
Search and view Visualizations
You can perform the following actions on the Search all tab:
-
Search Visualizations by keywords. For example, “Ethiopia conflict.”
-
Filter by Visualization type:
-
Visualizations: Visualizations from other users that are shared with you, in addition to Visualizations that you have built and saved.
-
Data Discovery Tool: Visualizations that provide insights into the data held in the FEWS NET Data Warehouse. Learn more about Data Discovery Tools.
-
Visualization Dashboard: Dashboards of multiple Visualizations. For example, the Afghanistan Markets and Trade Dashboard includes Visualizations showing prices and exchange rates.
-
-
View search results in either a grid or list layout.
-
Favorite a Visualization by clicking the star. Click the star again to unfavorite.
-
Click on a title to open the Visualization.
Learn more about using Visualizations in the Data Explorer.