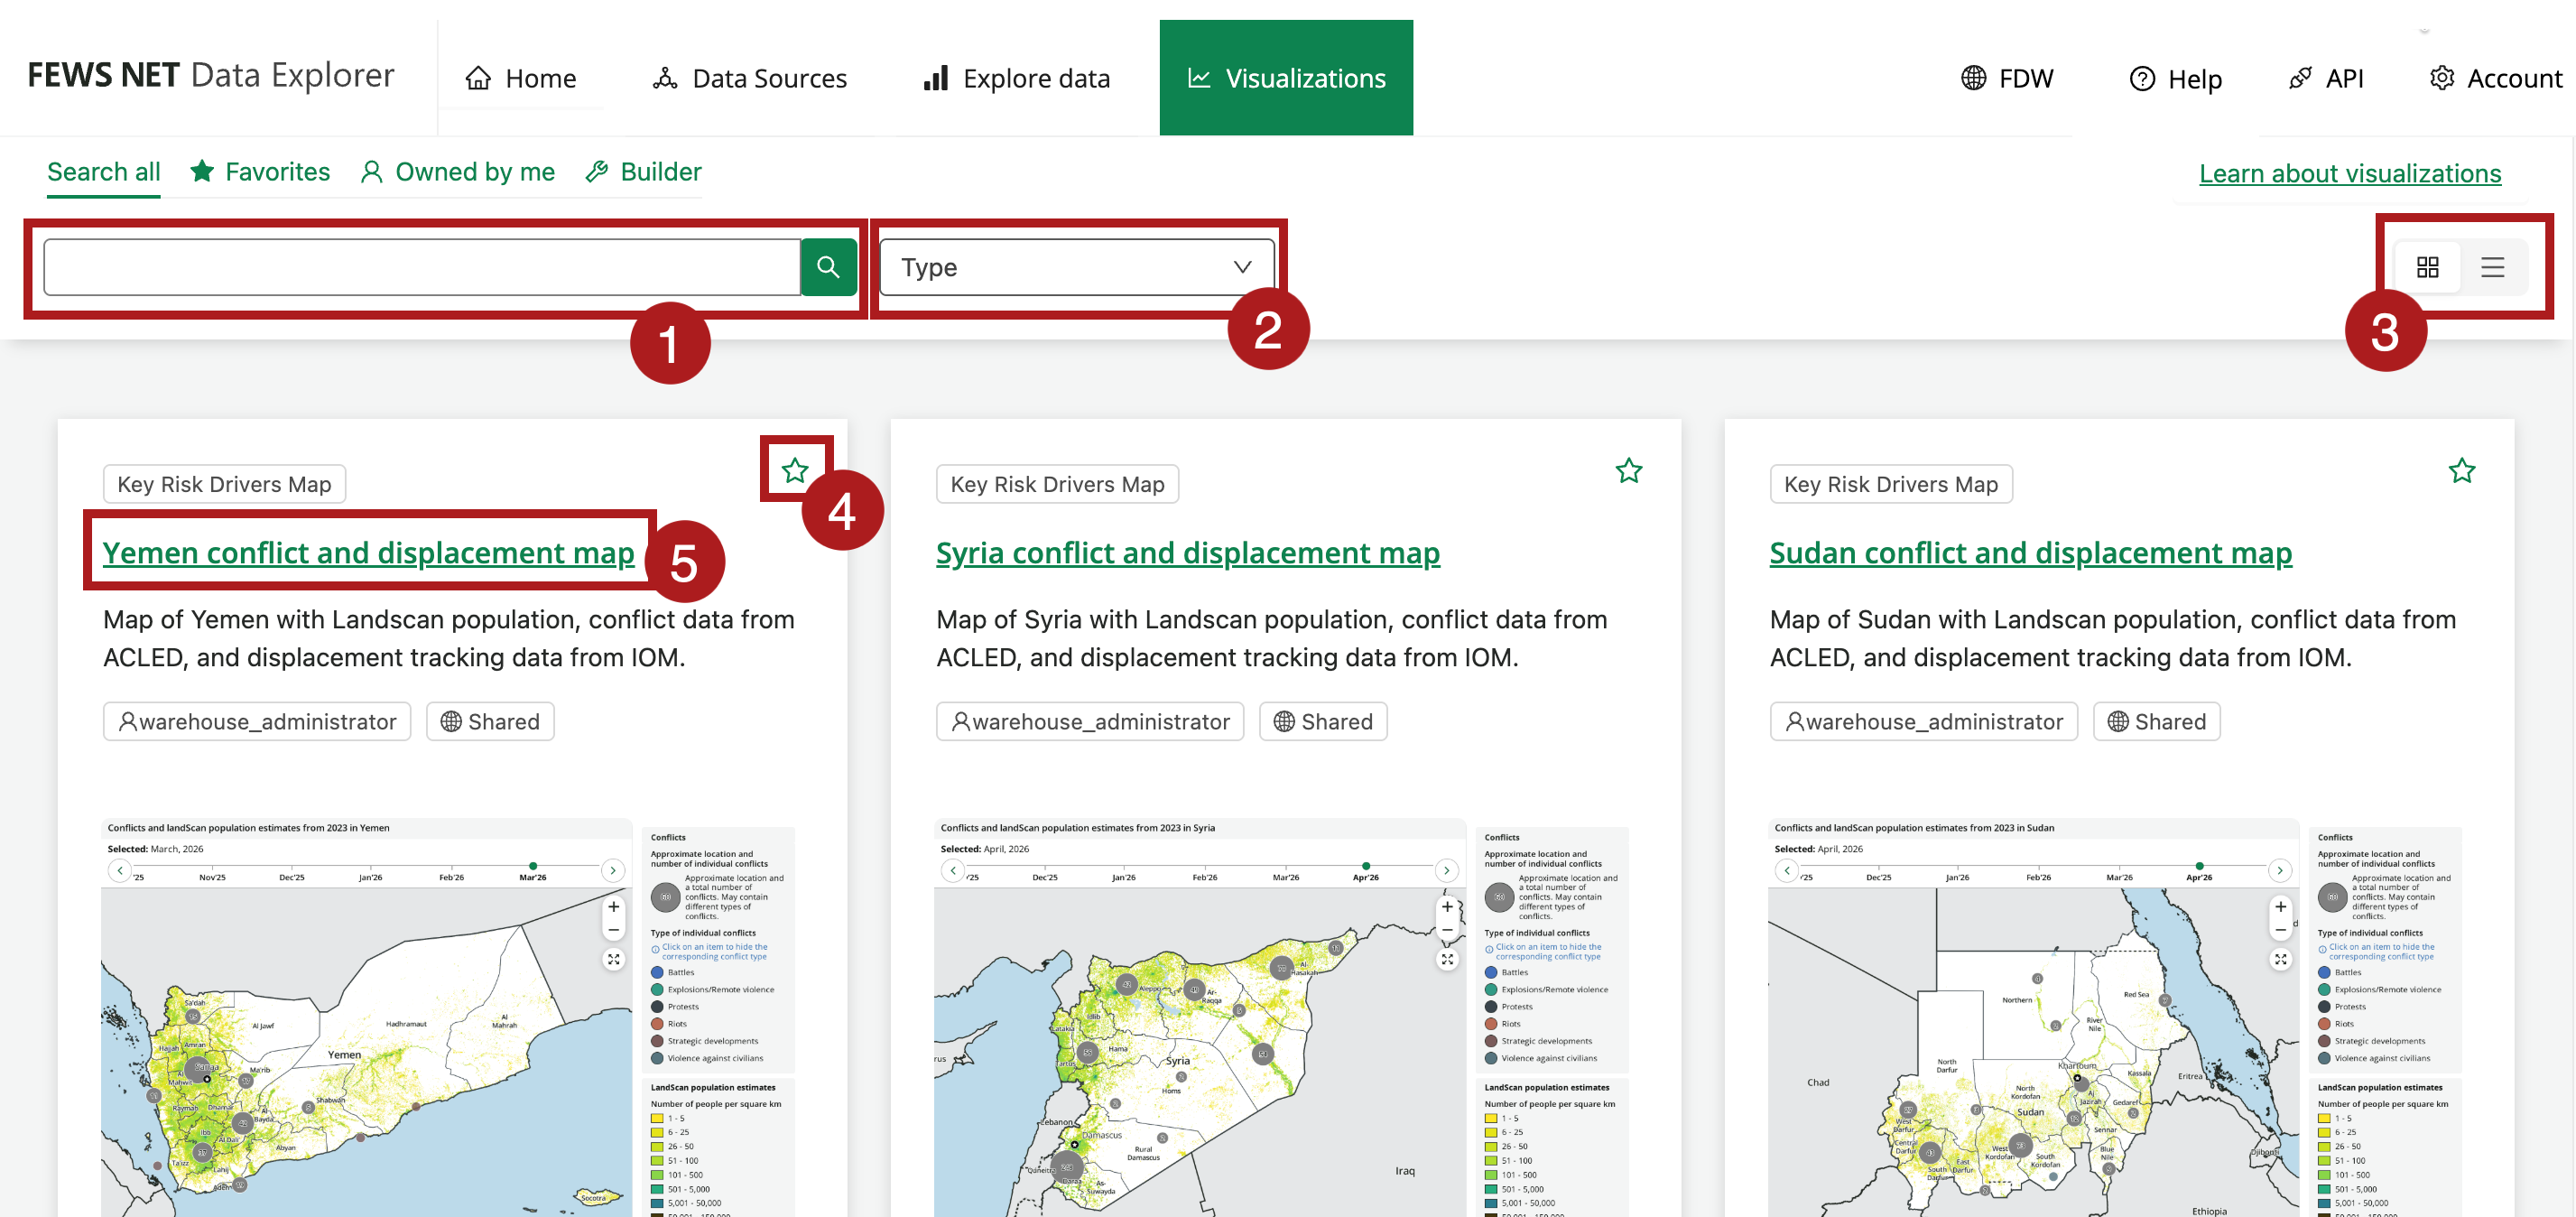
The Visualizations section allows you to view Visualizations and Dashboards, access Data Discovery Tools, and build and save Visualizations.
The Visualizations functionality is divided into the following tabs:
Search all: Search and view Visualizations, Data Discovery Tools, and Visualization Dashboards.
Favorites: View Visualizations that you have favorited.
Owned by me: View Visualizations that you have built and saved.
Builder: Search and select a Visualization template to build a Visualization. Learn more about building Visualizations.
Search and view Visualizations
You can perform the following actions on the Search all tab:
-
Search Visualizations by keywords. For example, “Ethiopia conflict.”
-
Filter by Visualization type:
-
Visualizations: Visualizations from other users that are shared with you, in addition to Visualizations that you have built and saved.
-
Data Discovery Tool: Visualizations that provide insights into the data held in the FEWS NET Data Warehouse. Learn more about Data Discovery Tools.
-
Visualization Dashboard: Dashboards of multiple Visualizations. For example, the Afghanistan Markets and Trade Dashboard includes Visualizations showing prices and exchange rates.
-
-
View search results in either a grid or list layout.
-
Favorite a Visualization by clicking the star. Click the star again to unfavorite.
-
Click on a title to open the Visualization.