
The data available in the FEWS NET Data Explorer (FDE) can be used to create a number of interactive data Visualizations. These Visualizations can be saved to your FDE account for easy future access, and can be downloaded as static images.
You can browse and search the available Visualization templates from the Builder tab. Click the Create button to begin building a Visualization.
Using the Visualization templates
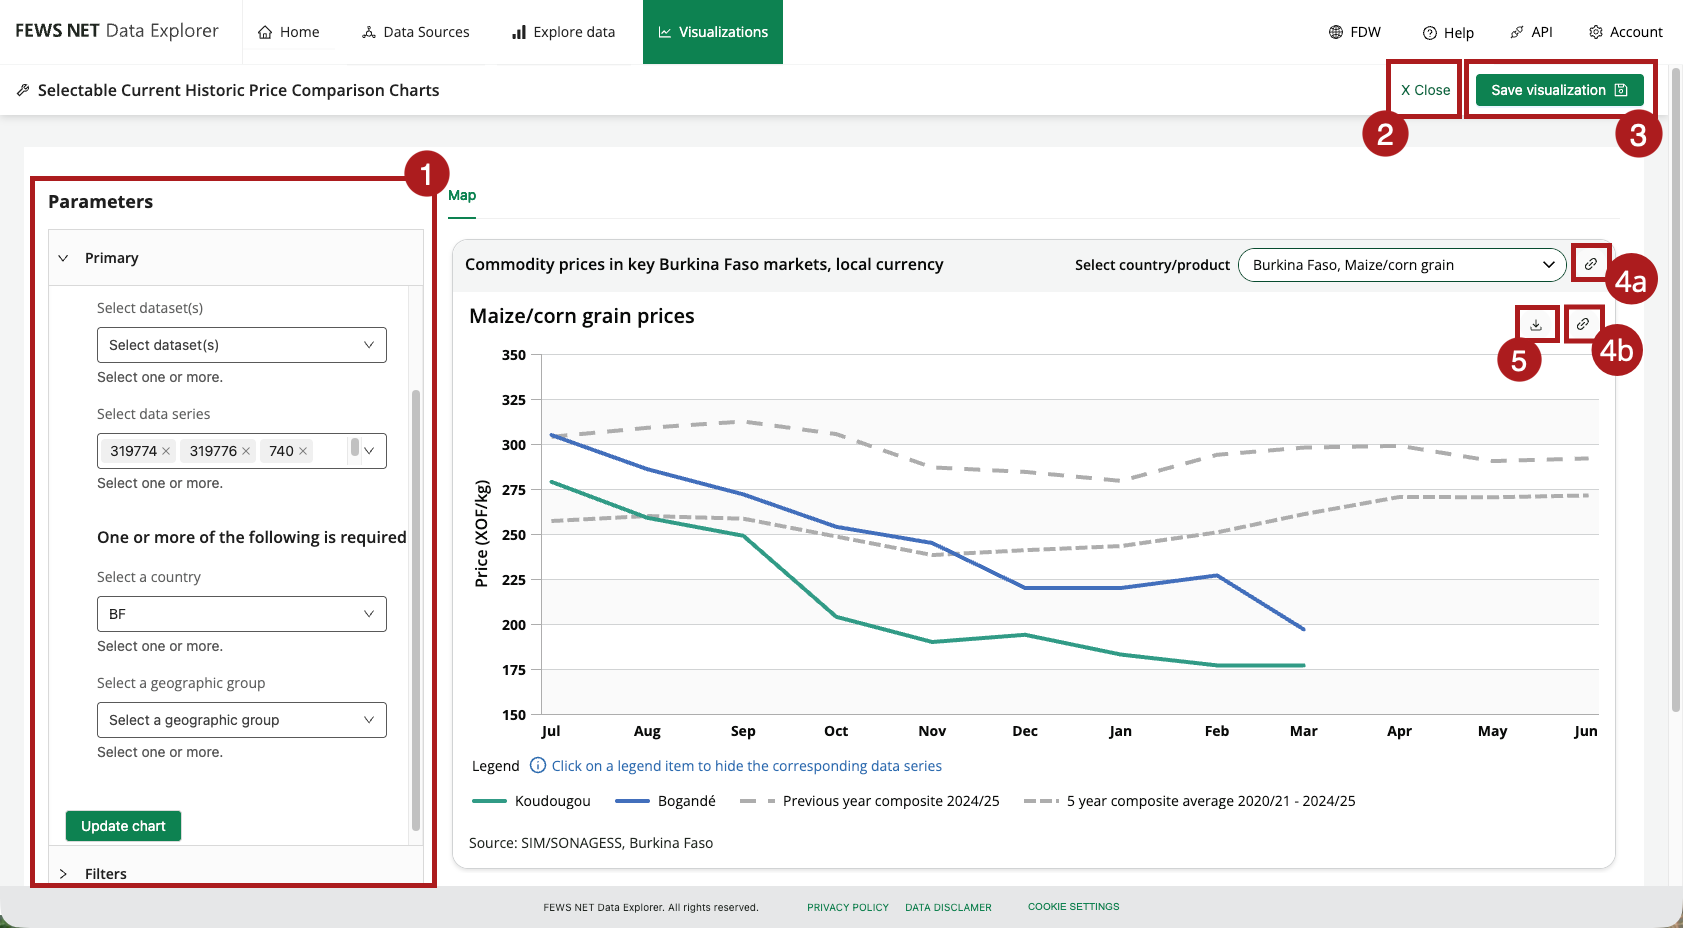
Creating and saving Visualizations involves the following key components:
-
Parameters: Choose primary parameters and optional filters for your Visualization.
-
Close button: Takes you back to the search page of the Builder tab.
-
Save Visualization button: Allows you to save your Visualization.
-
Copy link to Visualization button:
-
Copies the link for a selectable Visualization or Dashboard.
-
Copies the link to an individual chart or map.
-
-
Download icon: Provides options to view and download your Visualization and its associated data.
Preparing data for Visualizations
Using Datasets
Many Visualizations are created using one or more Data Series or a Dataset. Creating your own Datasets can be a convenient way to retrieve the data you’d like to visualize. For more information, see Create and Save Datasets.
Reviewing submitted data (internal users only)
Internal users with the necessary permissions can use data that is in submitted status in the FEWS NET Data Warehouse (FDW) to create Visualizations. For example, you can create an Acute Food Insecurity Map with submitted data in order to review the Visualization before publishing the data.
If the data is changed in FDW, there may be a delay in the new data displaying in the Visualization as the cache must refresh.
Save and reopen Visualizations
Visualizations can be saved and retrieved for future use:
-
After you’ve created your Visualization, choose the Save Visualization button to the right of the Visualization type name.
-
Enter a Title and Description for your Visualization.
-
Click Save and view to return to the Visualization, or Save and create another to return to the list of templates.
Reopen and edit a saved Visualization
-
Select the Owned by me tab.
-
Select the Visualization Title to open it.
-
To edit the Visualization, click Edit parameters.
-
Remove, edit, or add parameters.
-
Click Update.
-
Click Save changes to save the updated Visualization to your account.
You can also search and open your saved Visualizations from the Search all tab.
Delete a saved Visualization
To delete a saved Visualization:
-
Open the Visualization from the Owned by me or Search all tab.
-
Click the delete icon to the right of the Visualization title.
-
From the confirmation screen, click Delete. Deleting a Visualization cannot be undone and other users will lose access if the Visualization is shared.
Visualization builder templates
Access tailored guidance on building the following Visualization types: