
Welcome to this month’s FEWS NET Data Explorer (FDE) updates.
The latest release brings a major addition: the new Visualizations section allows you to view and build a variety of interactive charts and maps. We’ve also made improvements that make it easier to search and browse Data Series. On the Crop topic page, you can now preview data for a particular location and product over time on a map.
Plus, watch this month’s how-to video for tips and strategies for browsing data.
Visualizations
The Visualizations section provides new ways to discover and analyze data. You can view pre-built Visualizations, create and save Visualizations, and build a list of favorites.
Pre-built Visualizations
From the Search all tab, you can access pre-built Visualizations, Data Discovery Tools, and Visualization Dashboards. Visualizations and Visualization Dashboards display data for a specific country or region, while Data Discovery Tools provide insights into the scope of the data held in the FEWS NET Data Warehouse across geographies and topics.
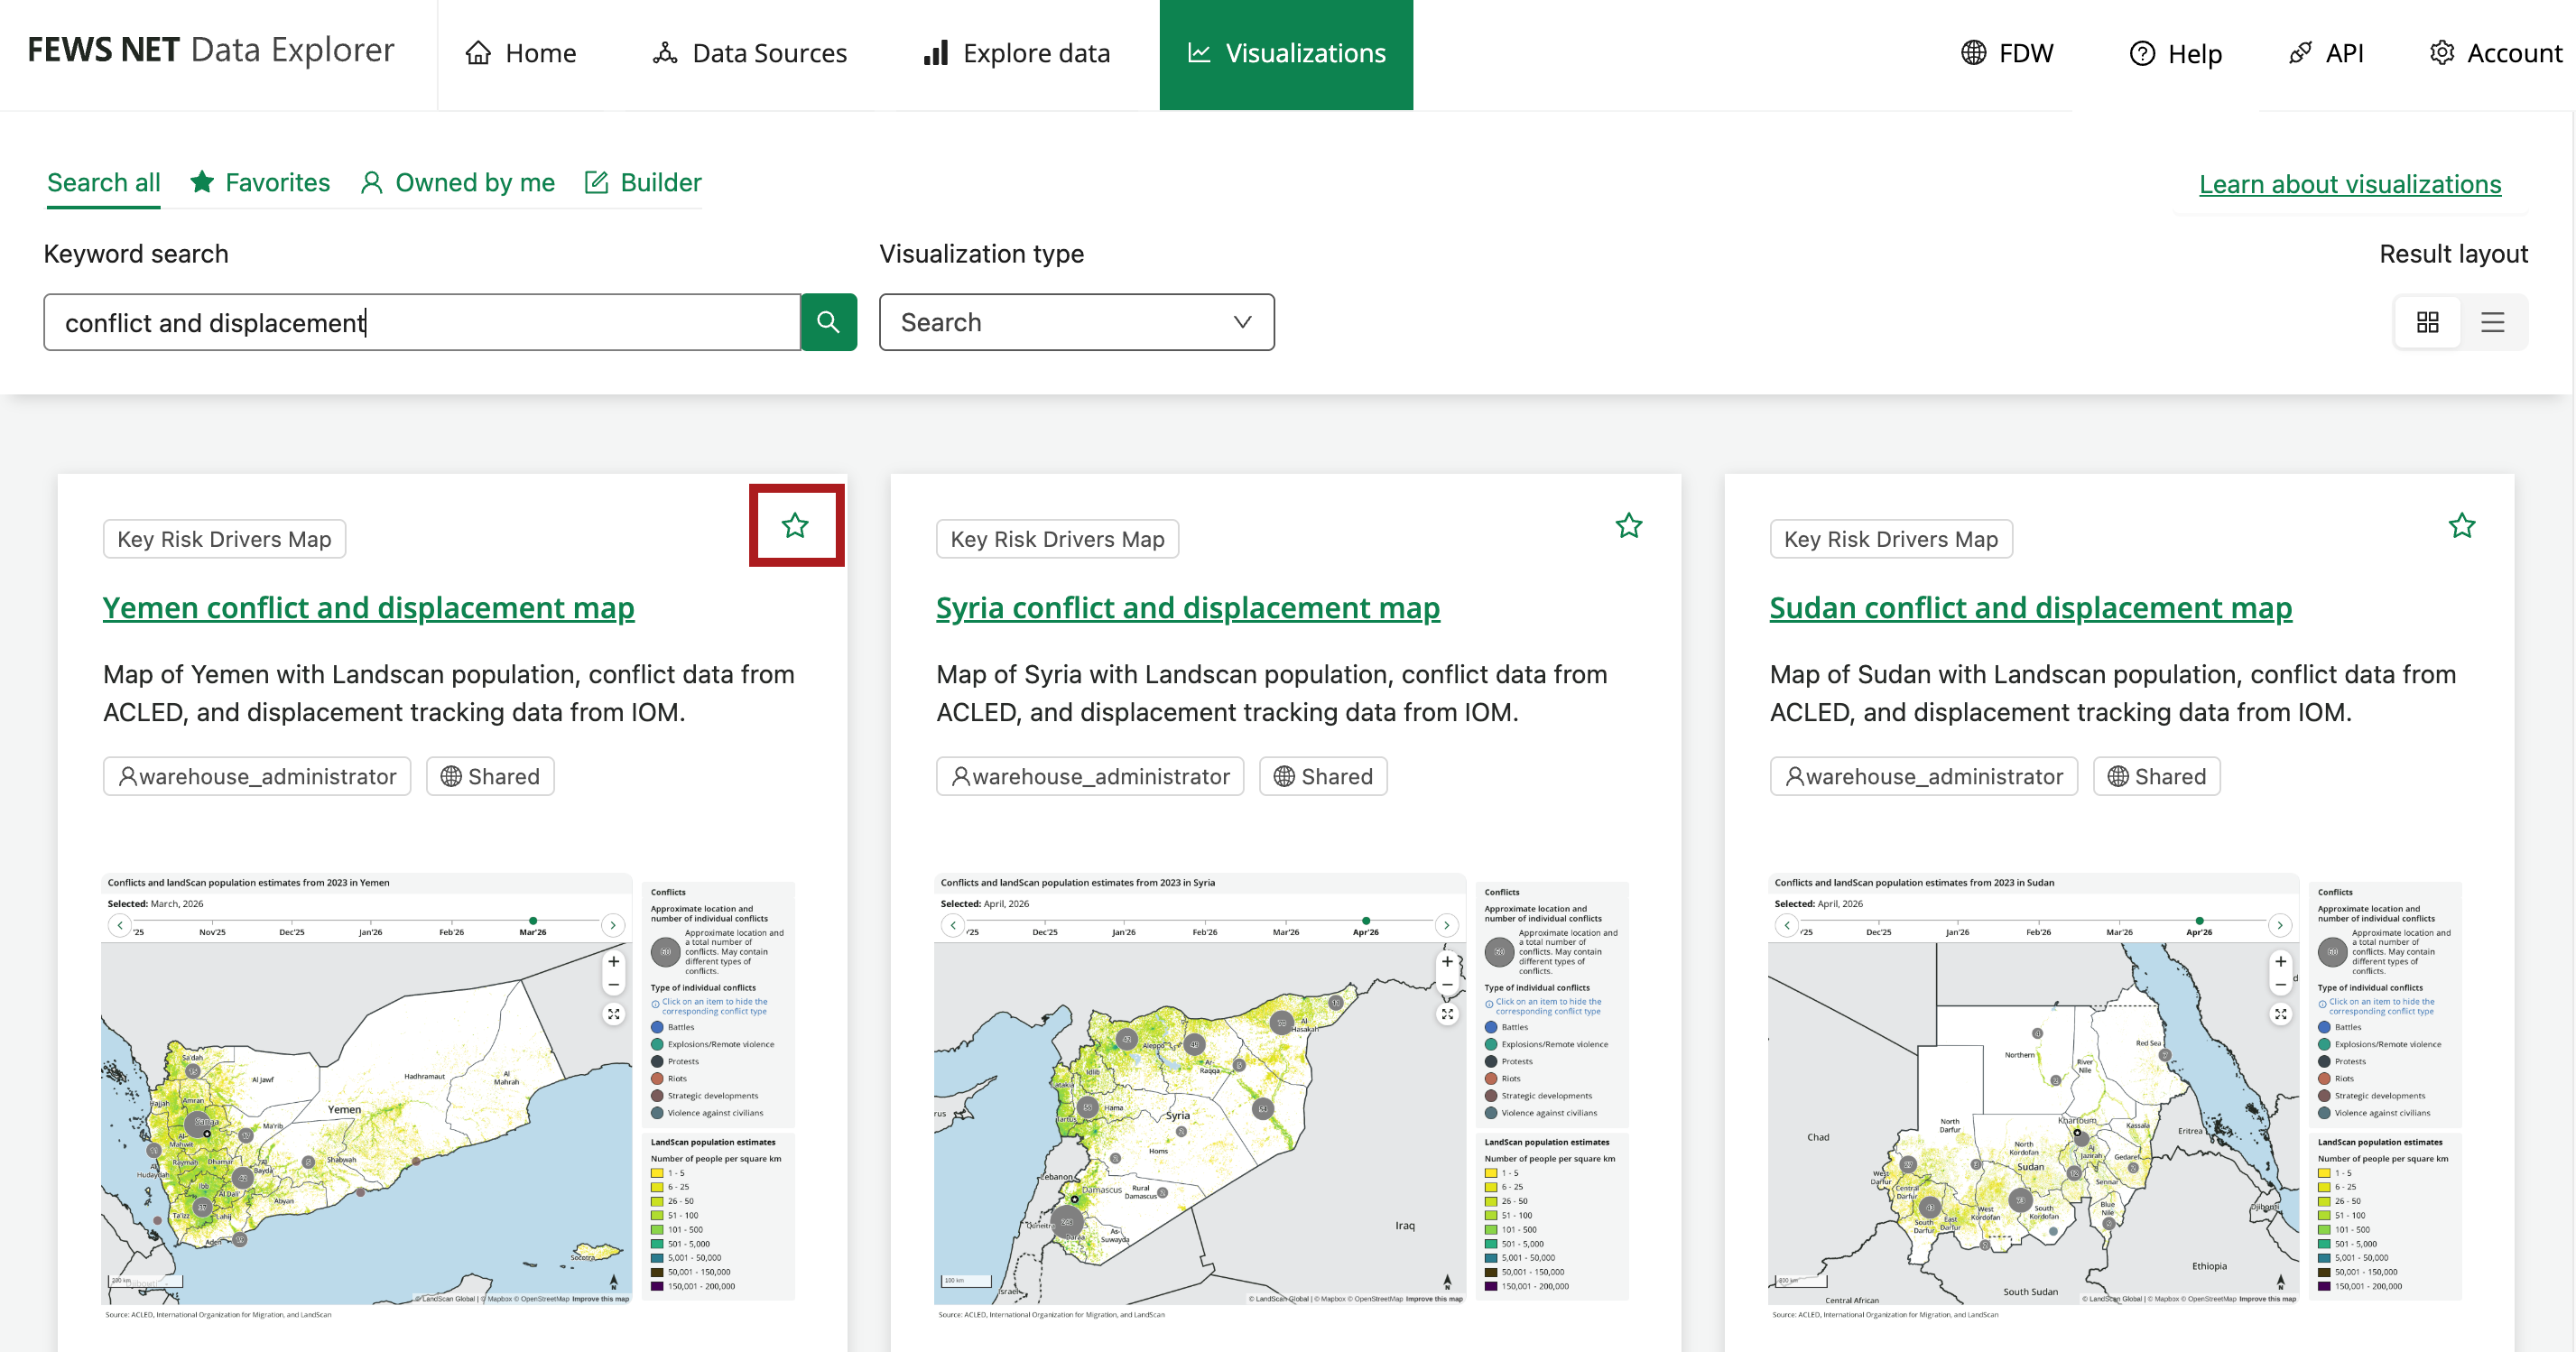
You can search using keywords and filter by the Visualization type. Star a Visualization to add it to your Favorites tab.
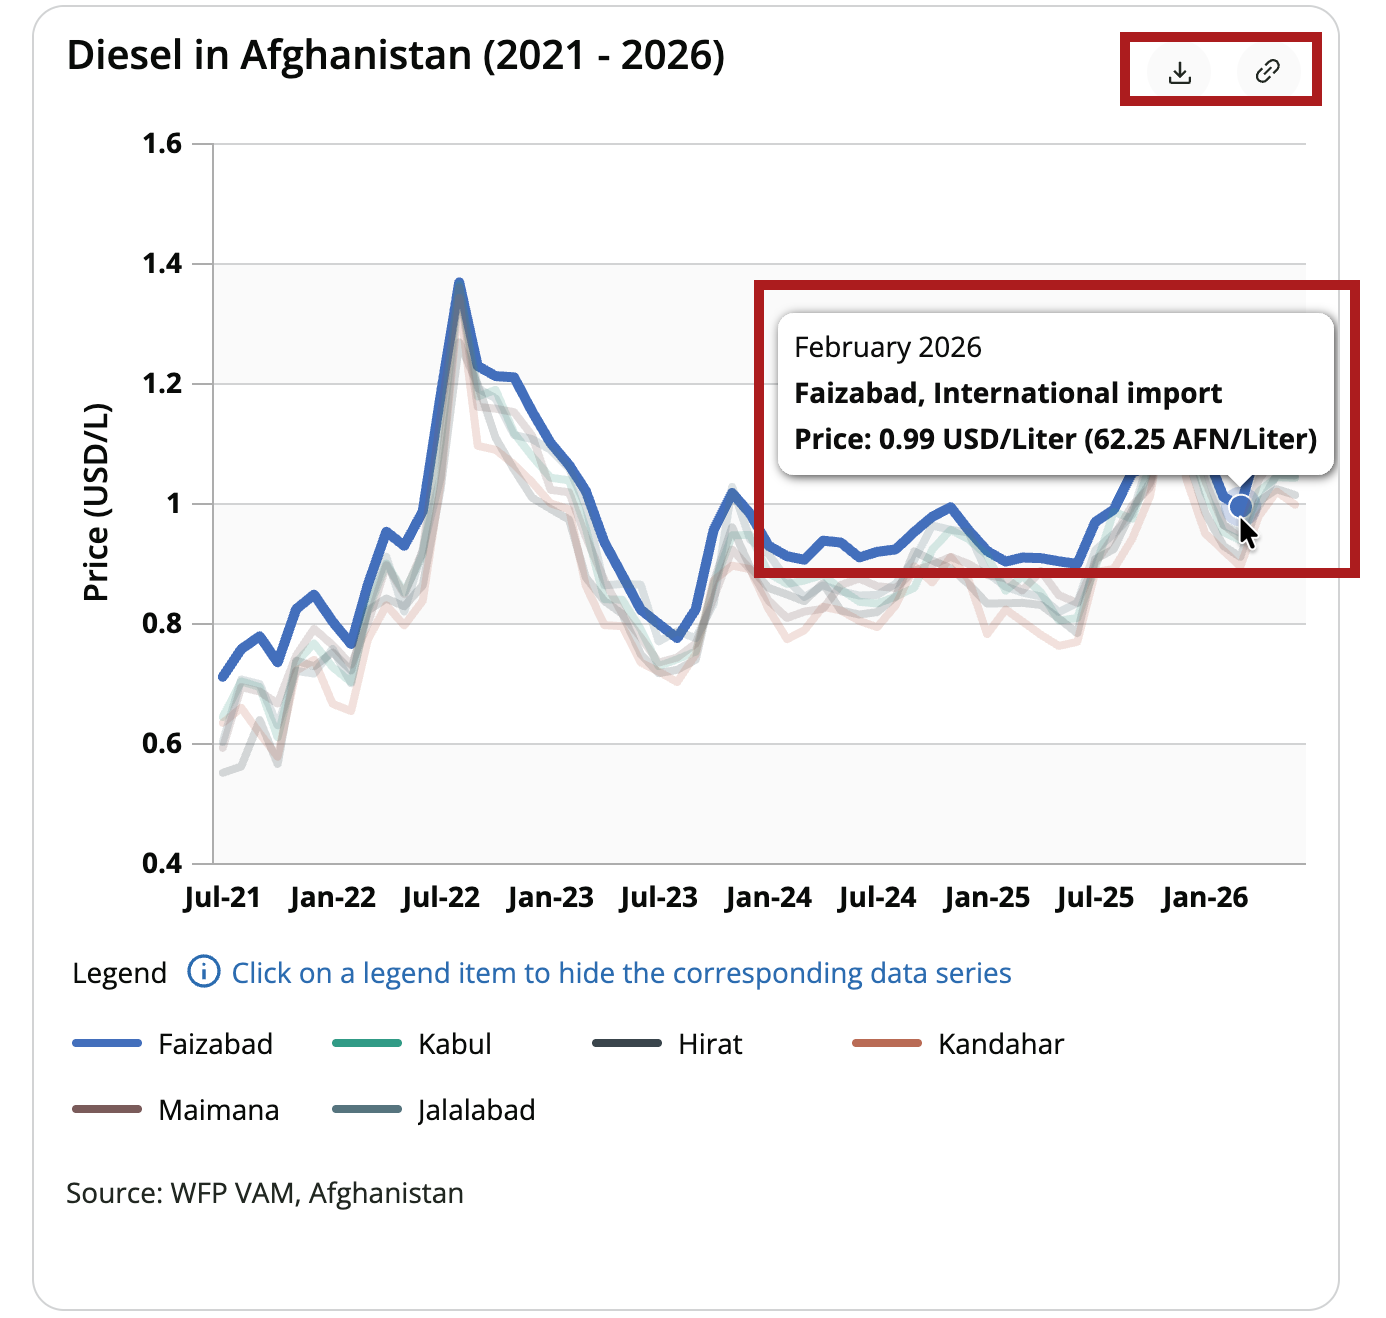
All Visualizations offer interactive features, such as the ability to hover over a point to view more details.
Use the Download button to generate a static PNG image or download the underlying data. Click on the Copy link to Visualization button to copy the Visualization URL, which can be opened in a browser window or added to an external dashboard. When sharing Visualizations from FDE, keep in mind that any data that is not publicly available will only be visible for logged in users who have permission to view it.
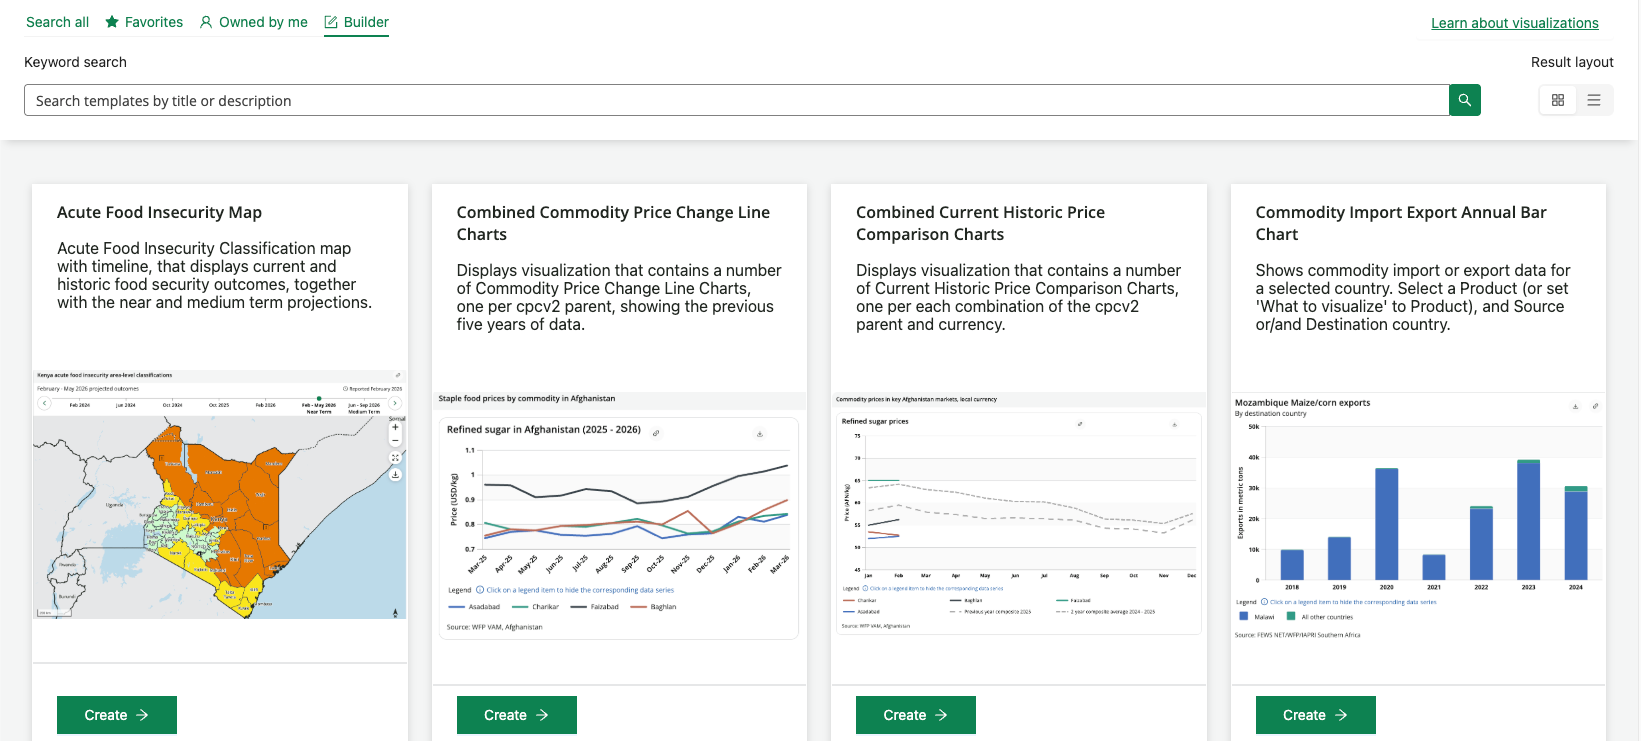
Visualization builder
From the Builder tab, you can create a variety of charts and maps by choosing from the available templates.
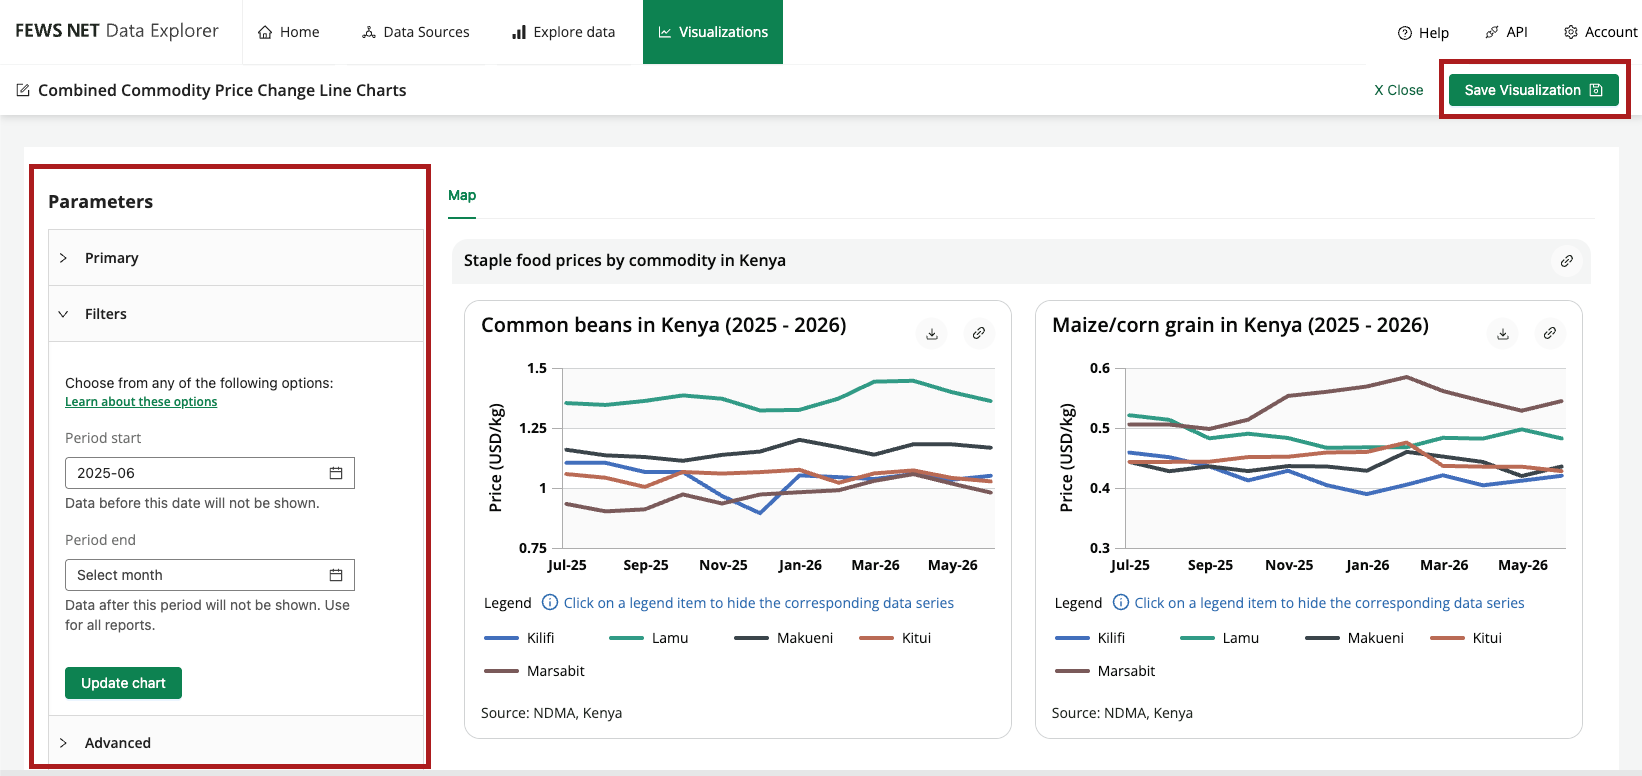
After selecting data, you can customize the Visualization by adding filters and advanced parameters.
Once you’ve finished refining your Visualization, click the Save Visualization button to add it to the Owned by me tab. You can view and edit your saved Visualizations.
Learn more about the functionality available through the Visualizations section.
Explore data updates
Cascading filters
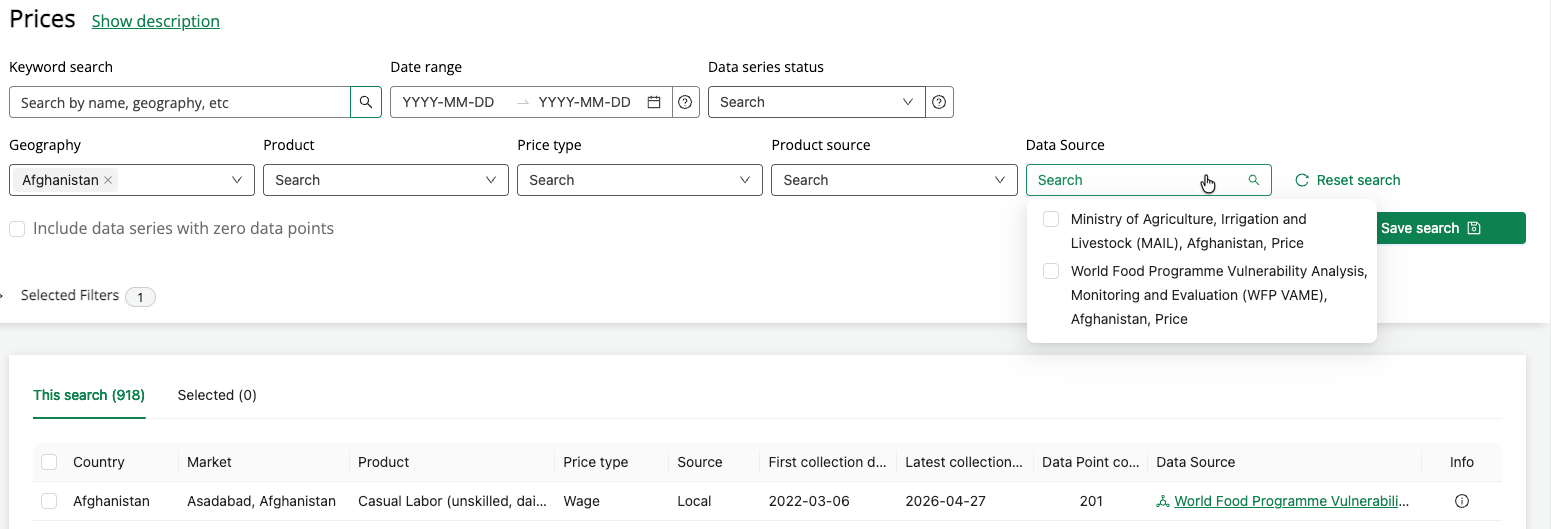
Once you make selections from the Geography filter on the Explore data topic pages, the Data Source dropdown now automatically filters to show options for the selected geography. This makes it easier to browse data from a particular source in a given location.
Crop map
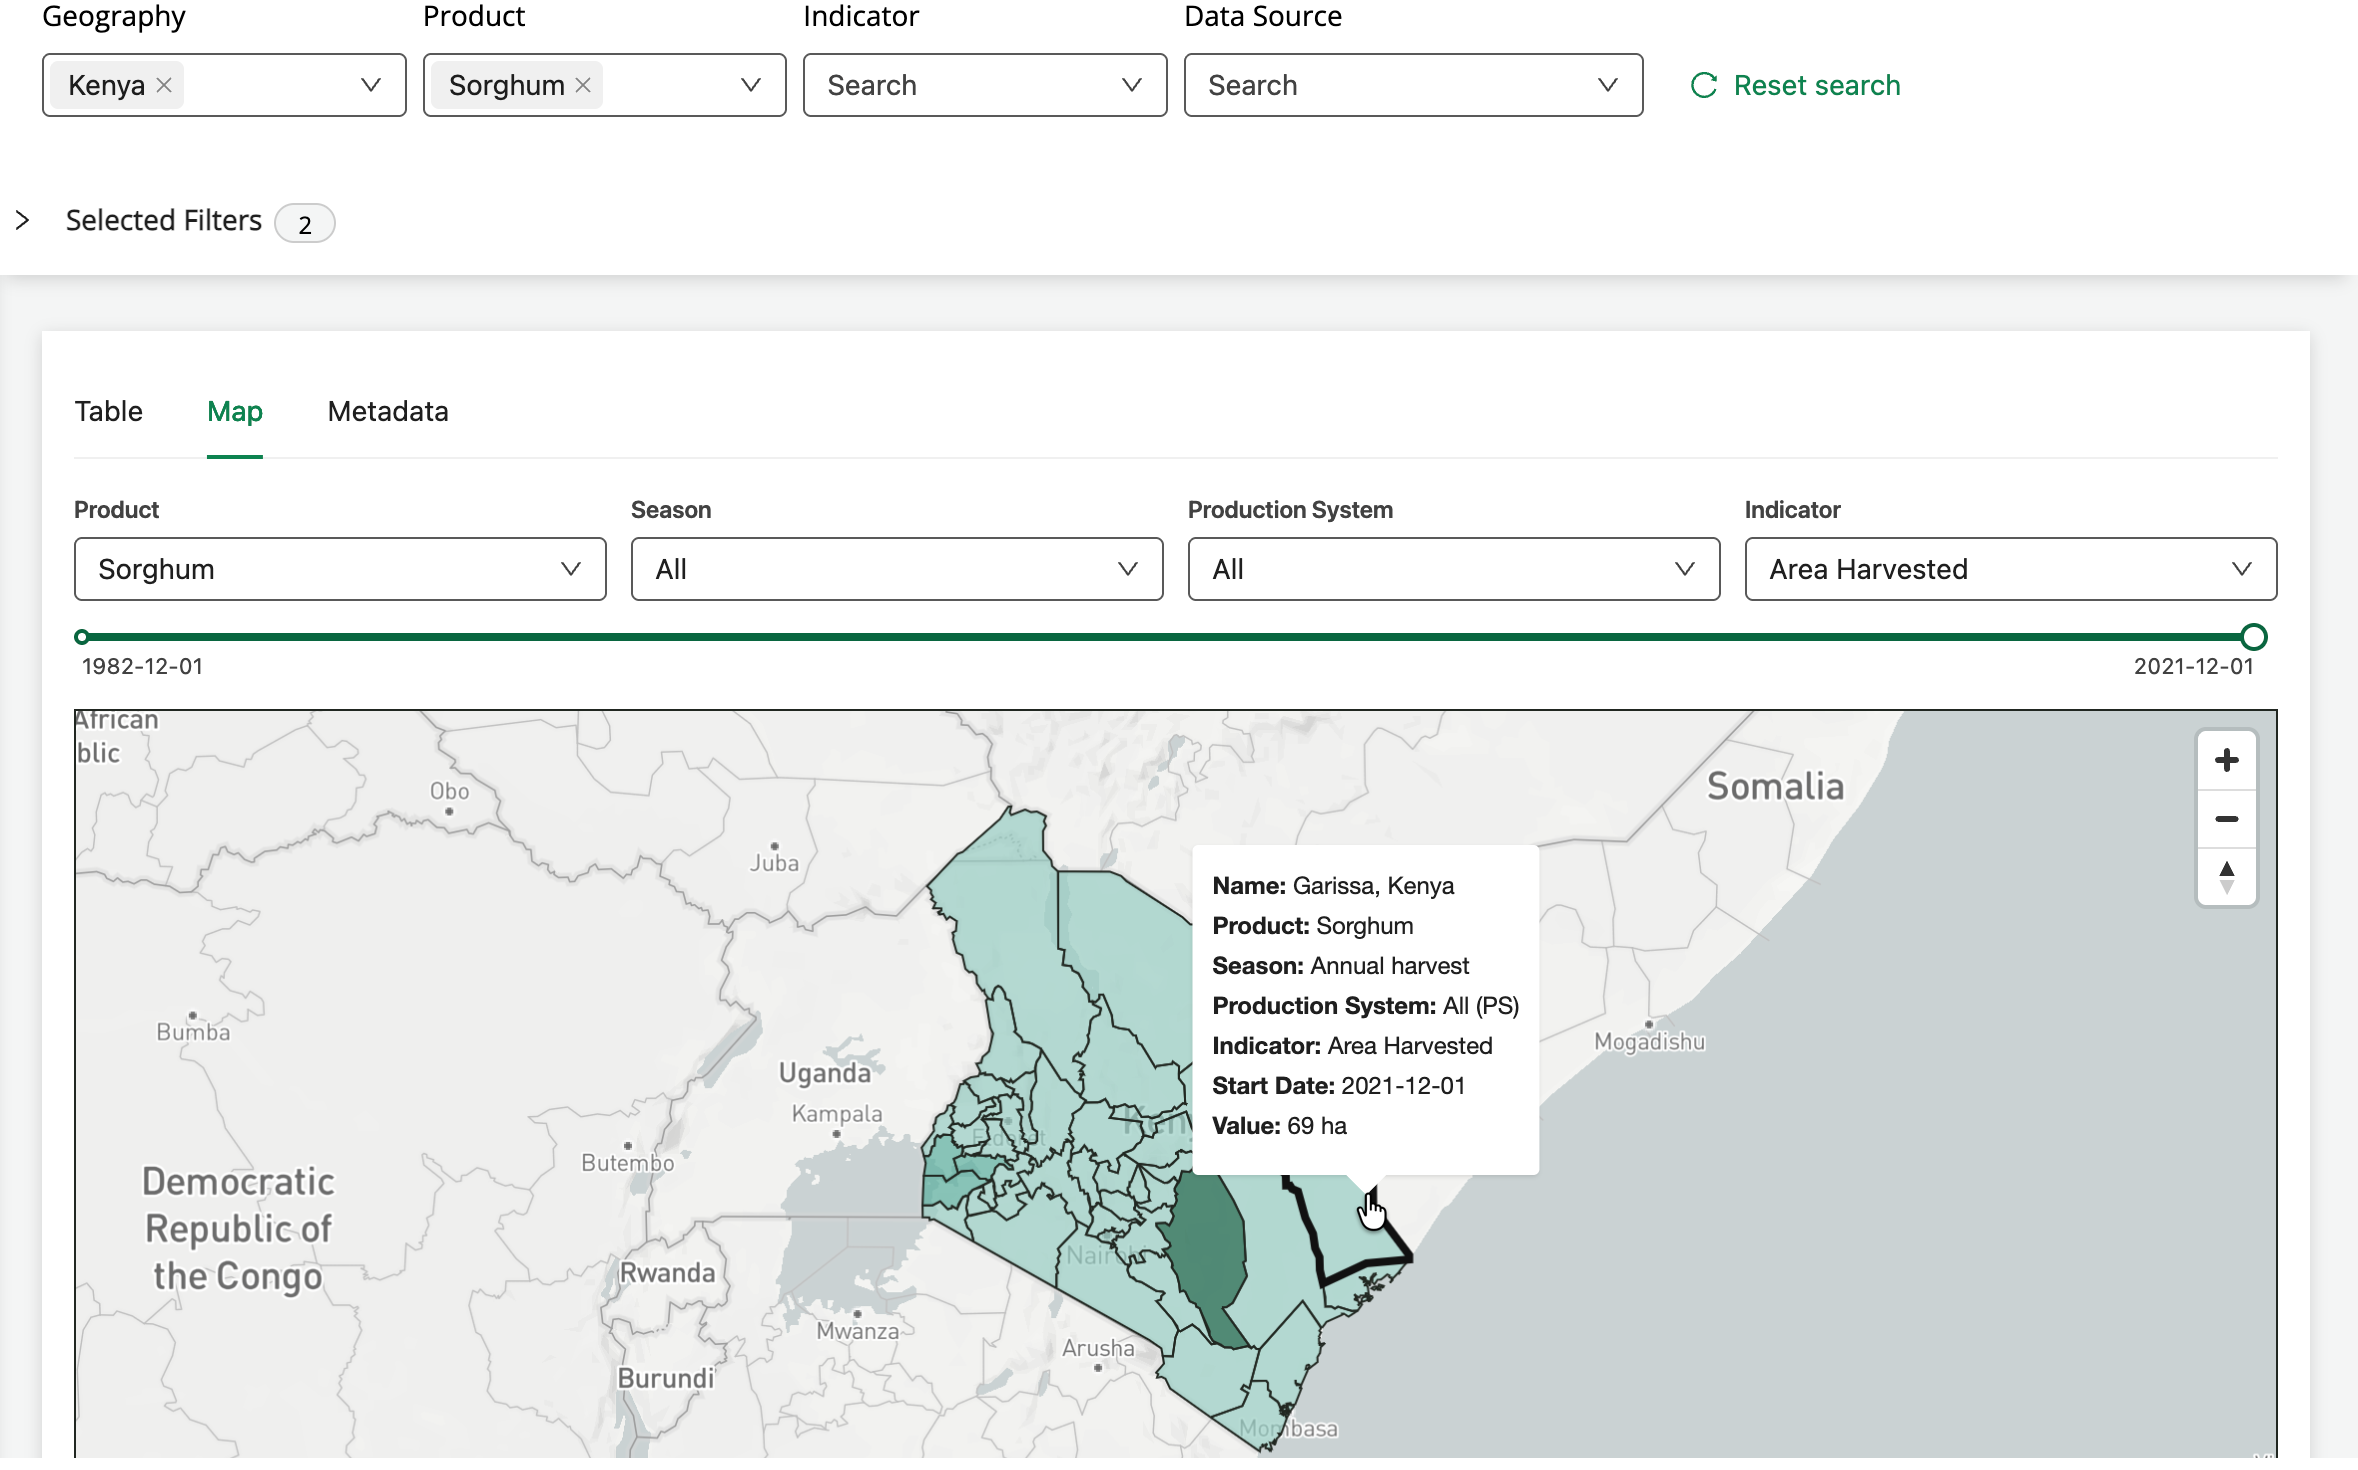
After filtering Data Series on the Crop topic page, you can select the Map tab to preview the data on an interactive map. Use the map’s filters to explore data for different products, seasons, production systems, and indicators. From the time slider, you can move between the available Data Collections. Hover over a polygon to view more details.
How to series: Search tips and strategies
The Explore data pages contain a variety of filters as well as keyword search options. Watch the how-to video below to learn how you can find and browse data most efficiently (04:13, includes closed captions).
If you’re new to the FDE or want a refresher, check out the Getting Started Guide for more details on exploring data.
Want FDE updates sent straight to your inbox? Subscribe to the release blog here.