The Data Freshness Tool visualizes the status of Data Collections in the FEWS NET Data Platform.
This tool can be used to confirm the status of existing Data Collections across multiple Data Source Documents. The tool will also provide a missing status for Data Collections that are scheduled but not yet loaded.
Options
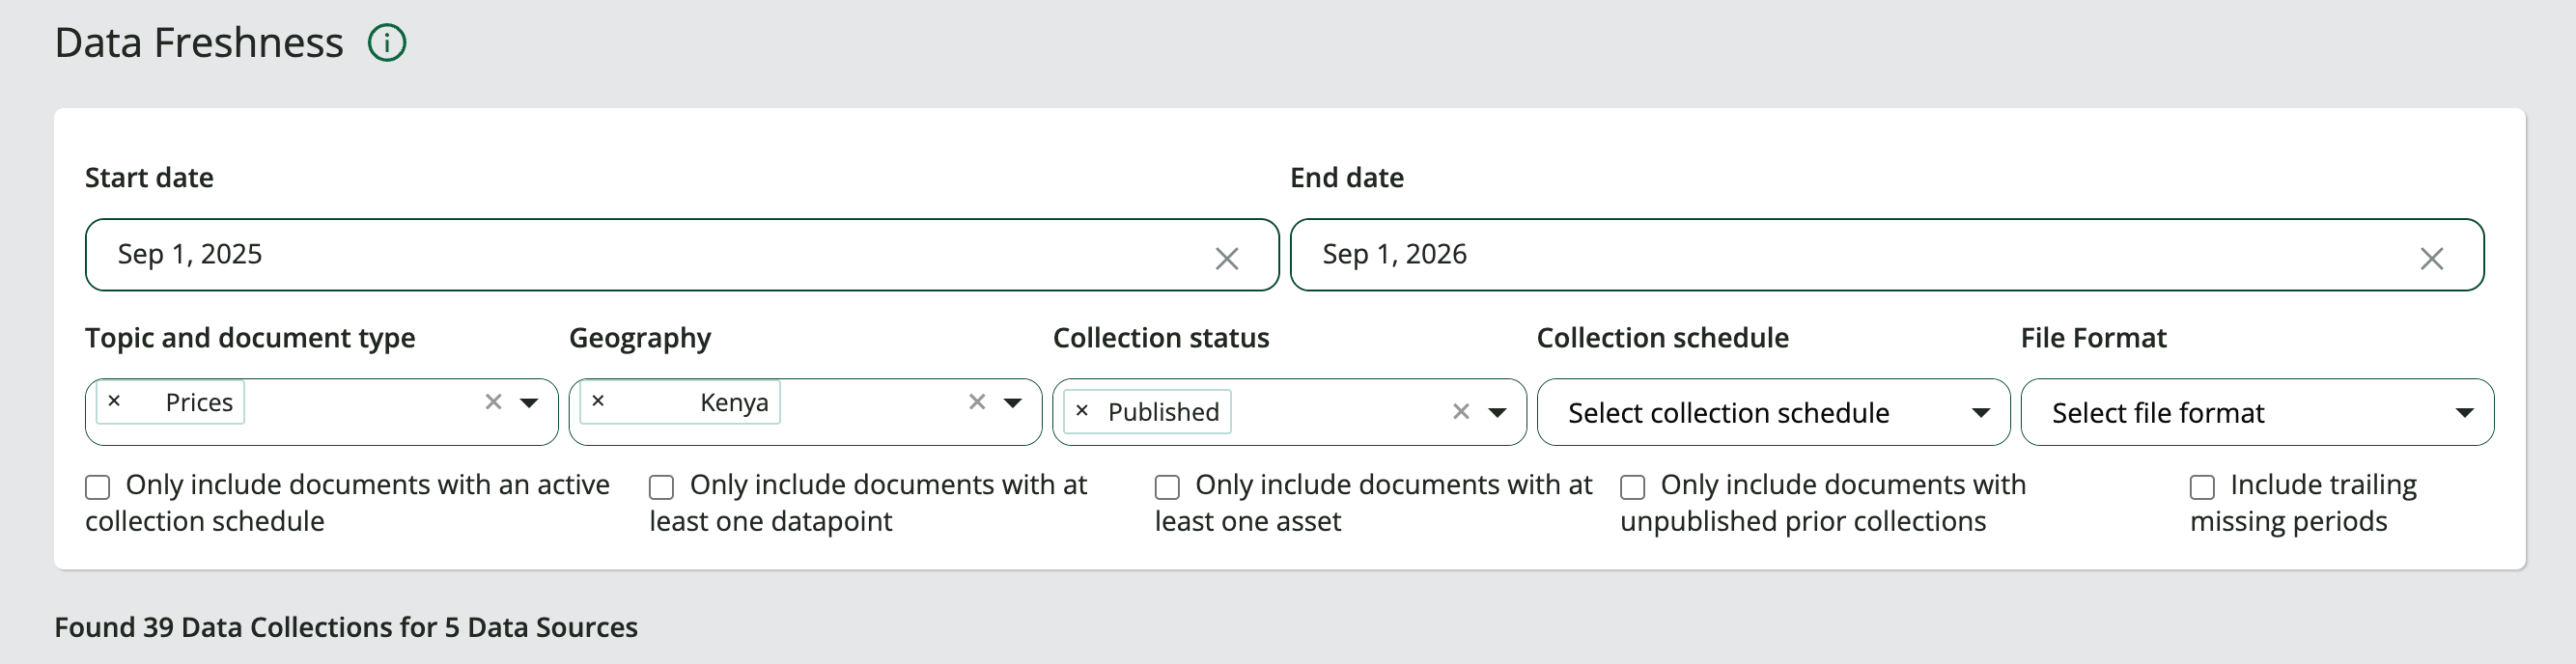
The available parameters for filtering Data Collections are:
Note: You can select the X to the left of any item in a filter to remove it from the chart.
-
Start date and End date: Filters Data Collections by the Data Point period dates.
-
Topic and document type: Select one or more Topics or Document Types.
-
Geography: Select one or more Regions or Countries.
-
Collection status: Select one or more Data Collection statuses.
-
Collection schedule: Select one or more Data Collection schedules.
-
File format: Filters for Data Collections with assets of the selected file format.
-
Only include documents with an active collection schedule: Select this option to filter for Data Source Documents with an active collection schedule.
-
Only include documents with at least one datapoint: Select this option to filter for Data Source Documents which contain at least one Data Point.
-
Only include documents with at least one asset: Select this option to filter for Data Source Documents that contain at least one Data Collection asset.
-
Only include documents with unpublished prior collections: Select this option to filter for Data Source Documents that contain prior Data Collections with a status other than Published.
-
Include trailing missing periods: Select this option to display missing periods for Data Source Documents without an end date.
Data freshness chart
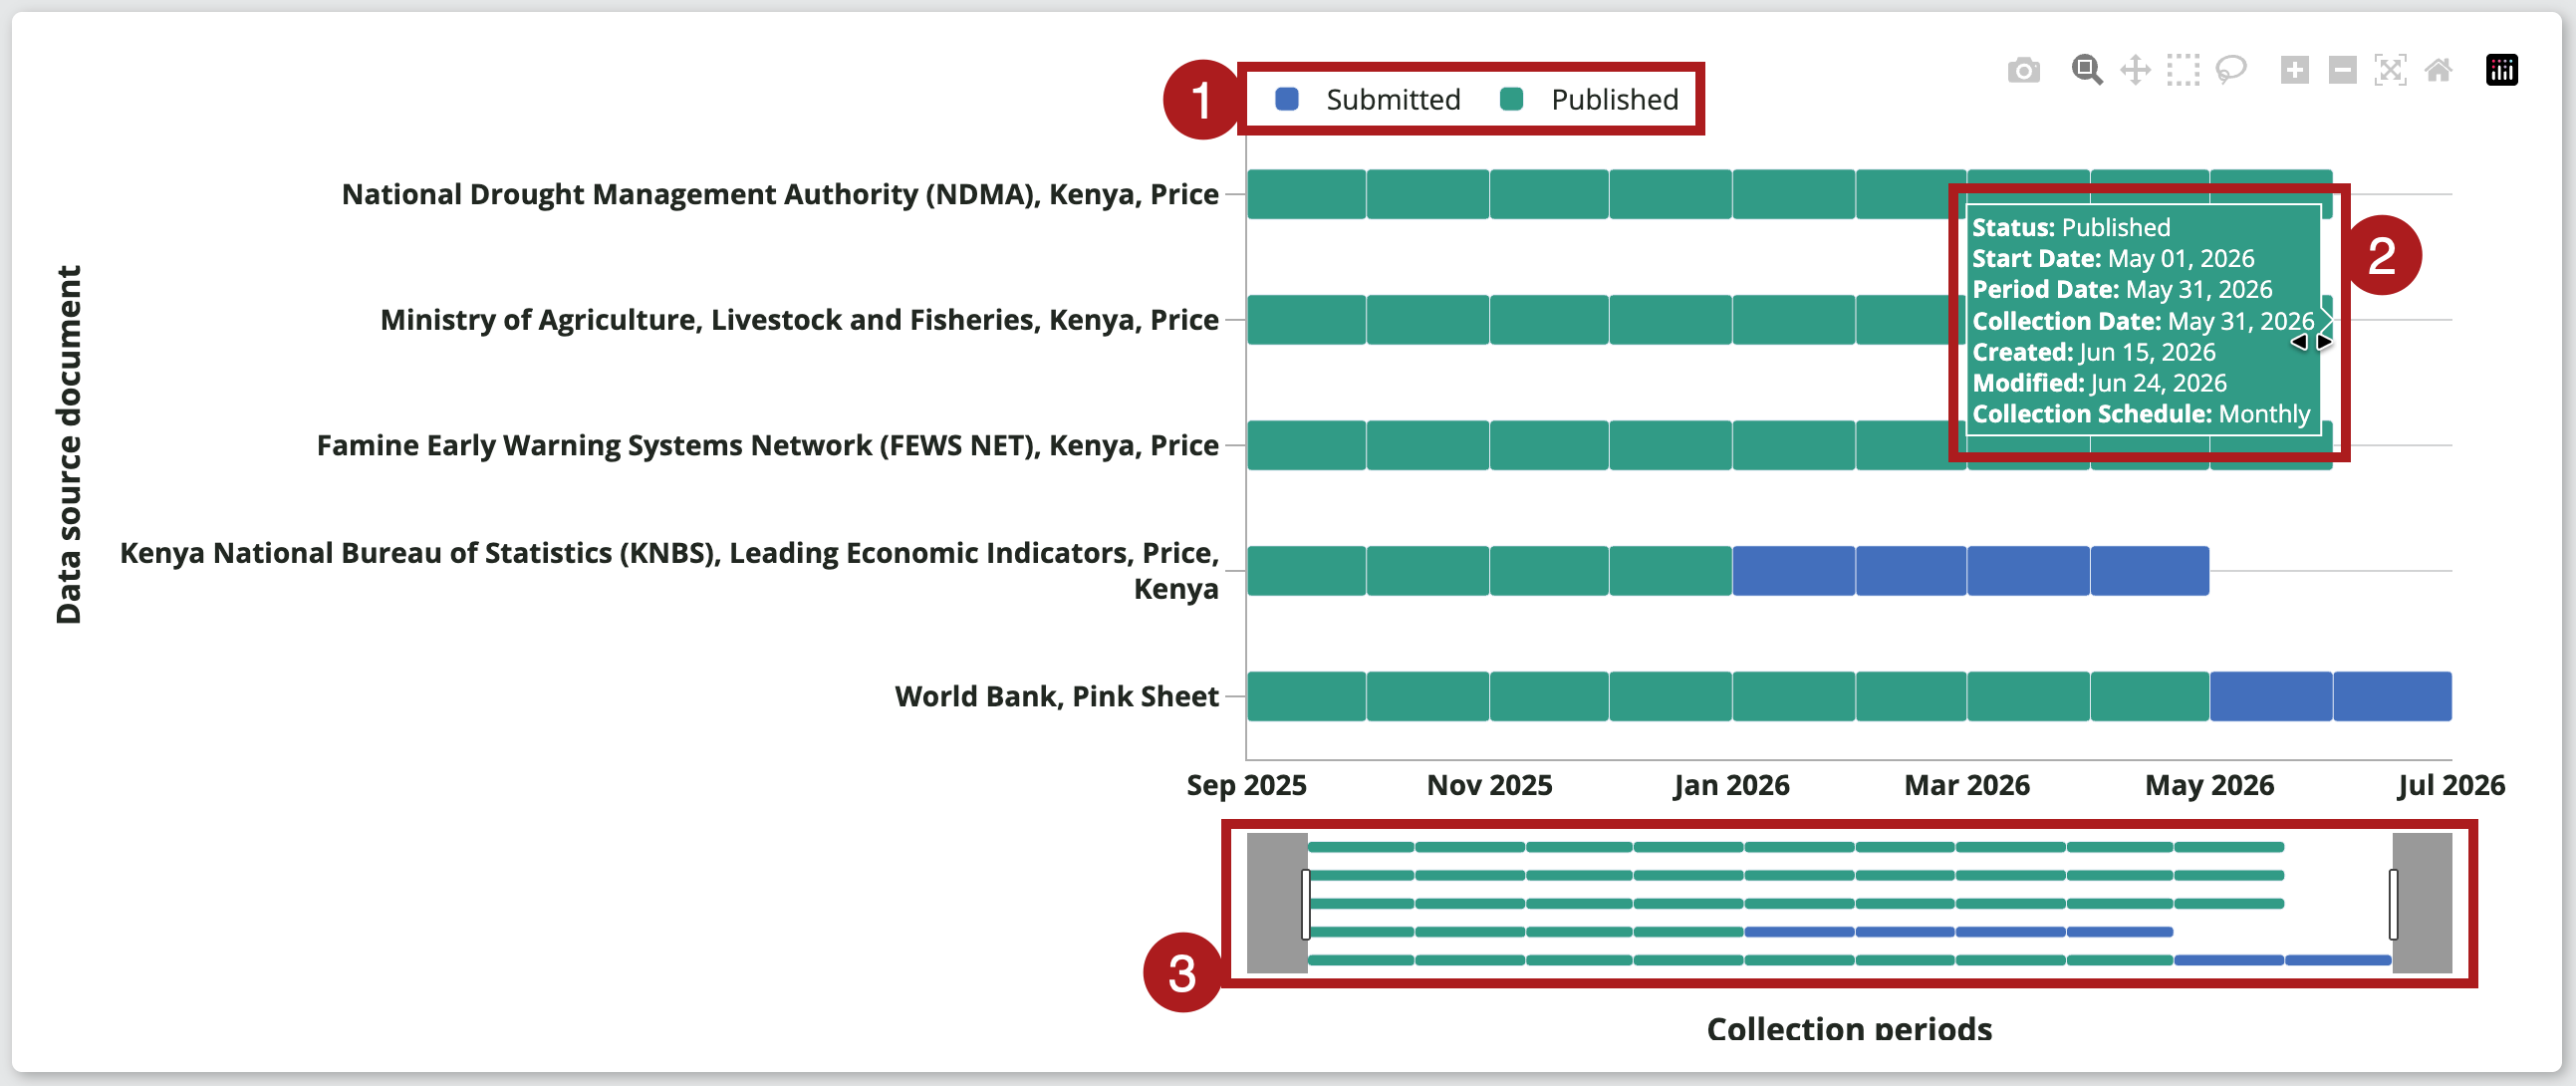
The information in the Data freshness chart is organized by Data Source Document (vertical axis) and date (horizontal axis). The legend at the top shows the included collection statuses.
You can interact with the chart in the following ways:
1. Collection status
Click on a collection status in the legend to remove data collections under that status from the chart. The removed collection status will appear grayed out in the legend. Click again to add Data Collections under that status back to the chart.
2. Data Collection details
Hover your cursor over a horizontal bar to view additional details for a Data Collection.
3. Range slider
You can zoom the horizontal axis using the slider located at the bottom of the tool. Click and drag the slider knobs to narrow the selected time range.