Getting Started Guide
This short guide covers the basics of using the FEWS NET Data Explorer (FDE). Scroll through the guide for a full review of the system, or use the menu on the right to skip to a specific topic.
About the FDE
The FEWS NET Data Platform acts as the central storage location and access portal for data used by FEWS NET for food security and early warning analysis. The Platform is made up of two primary sub-components:
The Data Explorer (focused on data access)
The Data Warehouse (focused on data storage)
This getting started guide focuses on use of the FEWS NET Data Explorer (FDE).
The primary purpose of the FDE is to provide you with easy access to data in the Data Platform. To accomplish this, data is categorized by industry and can be searched and filtered. You can explore and validate potentially relevant data using a combination of visualization tools such as tables, graphs, and maps before exporting it for use.
Note that the FDE does not provide access to all of the data FEWS NET holds. Some data has restricted permissions and some data can only be accessed by using the FEWS NET Data Platform API.
The FEWS NET Data Platform is designed to work with data from the following humanitarian sector components:
Population and demographic
Relief needs estimates and actual deliveries
Market prices
Agricultural production
Nutrition
Cross border trade
Livelihoods
Watch the short video below for an example use case. (1:39)
Navigate
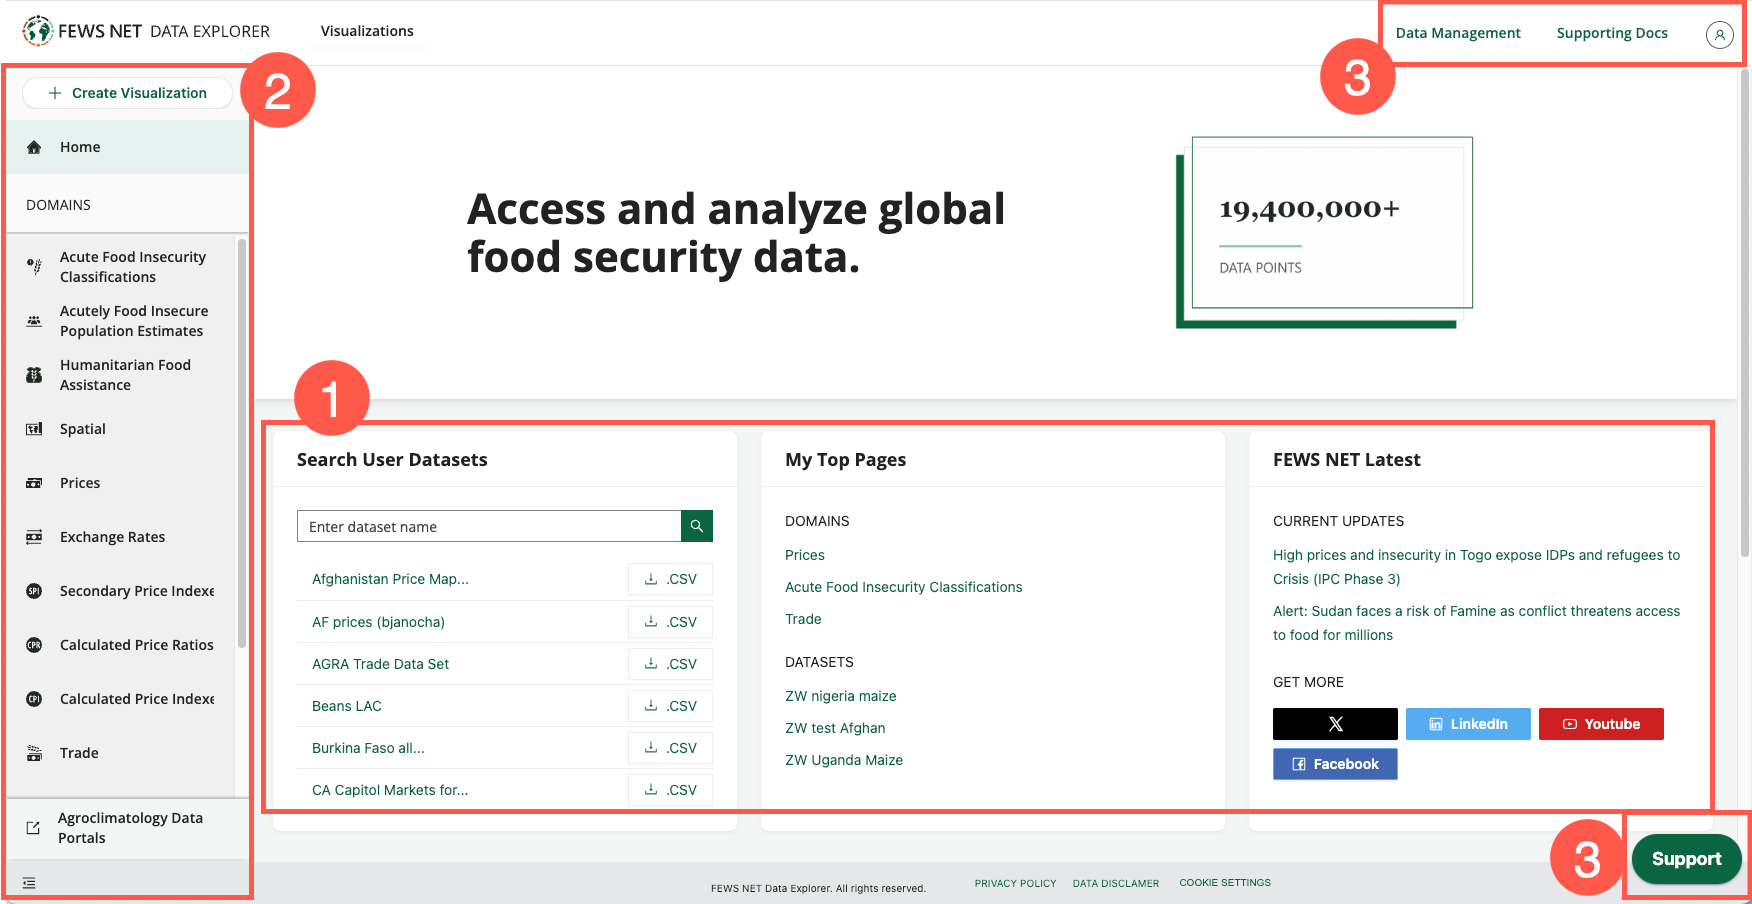
The FEWS NET Data Explorer (FDE) is structured as illustrated below:
Home page
Navigation menu
Support menus
Domain pages
Search and filter
Data selection
Data visualization and export
About Domains
Within the FEWS NET Data Explorer (FDE), humanitarian sector components are represented as Domains. A data domain is a grouping of data that contains a collection of data series. Domains are organized to unify and consolidate data based on metadata consistencies and sector relationships. For example, data on relief needs estimates and actual deliveries are included within the Responses Domain.
Choosing a Domain
To get started within the FDE, you must first choose one of the following domains from the navigation menu.
Some domains have limited visibility and may not be included in your view.
To request access to non-public data, submit a Help Desk form with information about the purpose of your analysis, why you need access specifically to this data, and your organizational affiliation. Your request will be reviewed internally to determine if additional permissions can be granted. Note that much of the data in the FEWS NET Data Warehouse is provided by third parties. Access to this data is subject to the licenses and conditions established by the original source organization.
You can click on any domain name below to learn more about the domain.
Domain | Description of data |
|---|---|
IPC Food Insecurity Classification (FIC) data which provides scale and scenario indicators on food insecure populations globally or for specific geographic locations | |
IPC Food Insecure Population Estimates (FIPE) data which provides phase and scenario indicators of food insecure populations | |
Humanitarian Food Assistance (HFA) data used as an indicator to identify famine and determine the severity of food security and nutrition crises | |
Geographic admin boundary information along with shapefiles, population estimates, and demography estimates, including male/female and age/gender breakdowns | |
Product and product market information (e.g., product source and product cost data at market and country level) | |
Interbank, government, secondary rate, and auction exchange rates | |
Consumer price indices and other price indices not calculated by FEWS NET | |
Price ratios calculated from FEWS NET system data | |
Price indices calculated from FEWS NET system data | |
Trade import and export data between source and destination countries at border points for various product types | |
Crop cultivation and harvest attributes (e.g., area harvested, planted, quantity produced, yield) | |
Health and nutrition indicator information (e.g., mortality rate, disease prevalence, death rate) | |
Cost and quantity of interventions in a given geographic area by various operators, including aid agencies | |
Population-related information (e.g., census data: population calculations, estimates, and percentages) | |
Number of days work of casual labor available per week in the selected market for Afghanistan | |
Information on remittances sent from overseas workers | |
Population counts and breakdowns by age and gender from officially published population estimates | |
Data series without system defined metadata (e.g., Sustainable Development Goals (SDG) and Human Development Index (HDI) data) |
Search and filter are domain specific. Text search and filter options are specific to each domain and do not work across domains. For example, searching for “Mortality rates” in the Price domain will yield “Nothing found” since mortality rates are included only in the Nutrition domain.
Search
When performing a search, results appear ordered by relevance. You can refine your search using operators such as single or double quotation marks, the word or, or a minus sign.
The table below contains examples of how to use these search operators.
Search | Results |
vegetable oil | results that contain those words in any order |
“vegetable oil” | only results that include that exact phrase |
“sunflower oil” “palm oil” | only results containing both phrases |
“sunflower oil” or “palm oil” | results that contain either phrase |
‘vegetable oil’ -‘palm oil’ | results about vegetable oil unless they include the phrase ‘palm oil’ |
Filter
Filters can be used in two ways:
Begin typing a term in the filter box to narrow the possible options.
Click on the filter box to browse a list of possible options.
Once you have found a relevant filter, through browsing or searching, click the box next to the filter name to use the filter on the available data.
Some filters aggregate items into multi-level lists (e.g., countries being aggregated into continents or sub-continents as shown in the image below). In these cases, selecting the higher-level item in the list will automatically select all the lower-level items in the list, as illustrated below.
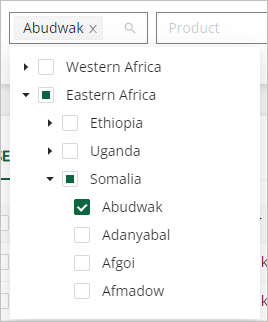
Choosing a single market selects only the market.
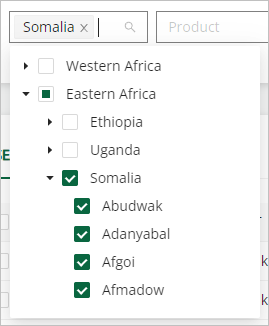
Choosing a country selects all markets in the country.
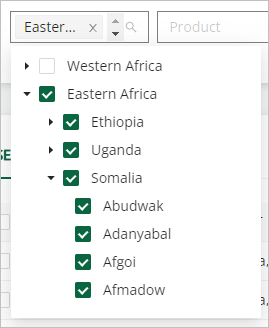
Choosing a region selects all countries and markets in the region.
Data Series with no Data Points
Check the Include data series with zero data points box to include data series in your search where the data has not yet been uploaded to the FEWS NET Data Platform.
View selected filters
The Selected Filters section allows you to view all selected filters at once and remove filters more easily. This section can be collapsed so that it does not take up space on your screen when it’s not needed.

Reset search
You can remove all your search and filter selections at any time using the Reset search button.
How to video: search tips and strategies
Watch the below video to learn more about using search terms and filters, as well as modifying and reseting your search criteria.
https://www.youtube.com/watch?v=eJMZVO22WtQ&list=PL_QD9ZK20-GWeKv8OrfEqy9prfqGBtW5w&index=3&pp=gAQBiAQB:About Data Series and Datasets
Once you have applied your search terms and filters, you will be presented with a list of all available data series that match your criteria.
A data series is a collection of related data points from a single data source that are viewable as a single row within a table of data. They represent the change over time for a specific indicator. Data series are presented in table format and ordered alphabetically by country or name. They are always found beneath the search and filter section.
A dataset is a collection of data series.
For the Spatial domain, Geo Unit Set Versions are used instead of Data series.
Create Datasets
You can create a dataset by selecting the checkboxes next to one or more data series in the This Search tab. You can clear your selections using the Clear Selection button.
The quantity of selected data series will be displayed next to the Selected tab. Click on this tab to view all of the data series you selected.
Save Datasets
You can save both selections and searches that you think you will want to access in the future.
Selections save only the data series you have selected. The data series included within these datasets will not change over time. However, when accessed, the system automatically fetches the most current data within those data series from the server. To save a selection, click the Save Selection button.
Searches save your search parameters and selected filters. When accessed, the system automatically fetches the most current list of data series from the server that matches those saved parameters. Therefore, the set of data series within a saved search may change over time. To save a search, click the Save Search button.
In the dialogue box that opens after you click the Save Selection or Save Search button, enter a name and description for the new search or selection. Visibility and ownership rights can also be set from here.
View Saved Datasets
To access saved datasets:
Navigate to the domain in which you would like to view the saved dataset.
Click the View Datasets button in the search and filter box.
You will see a list of saved datasets organized by visibility.
Click on any row to open the dataset listed in that row.
Learn more
Visualize and Export Data
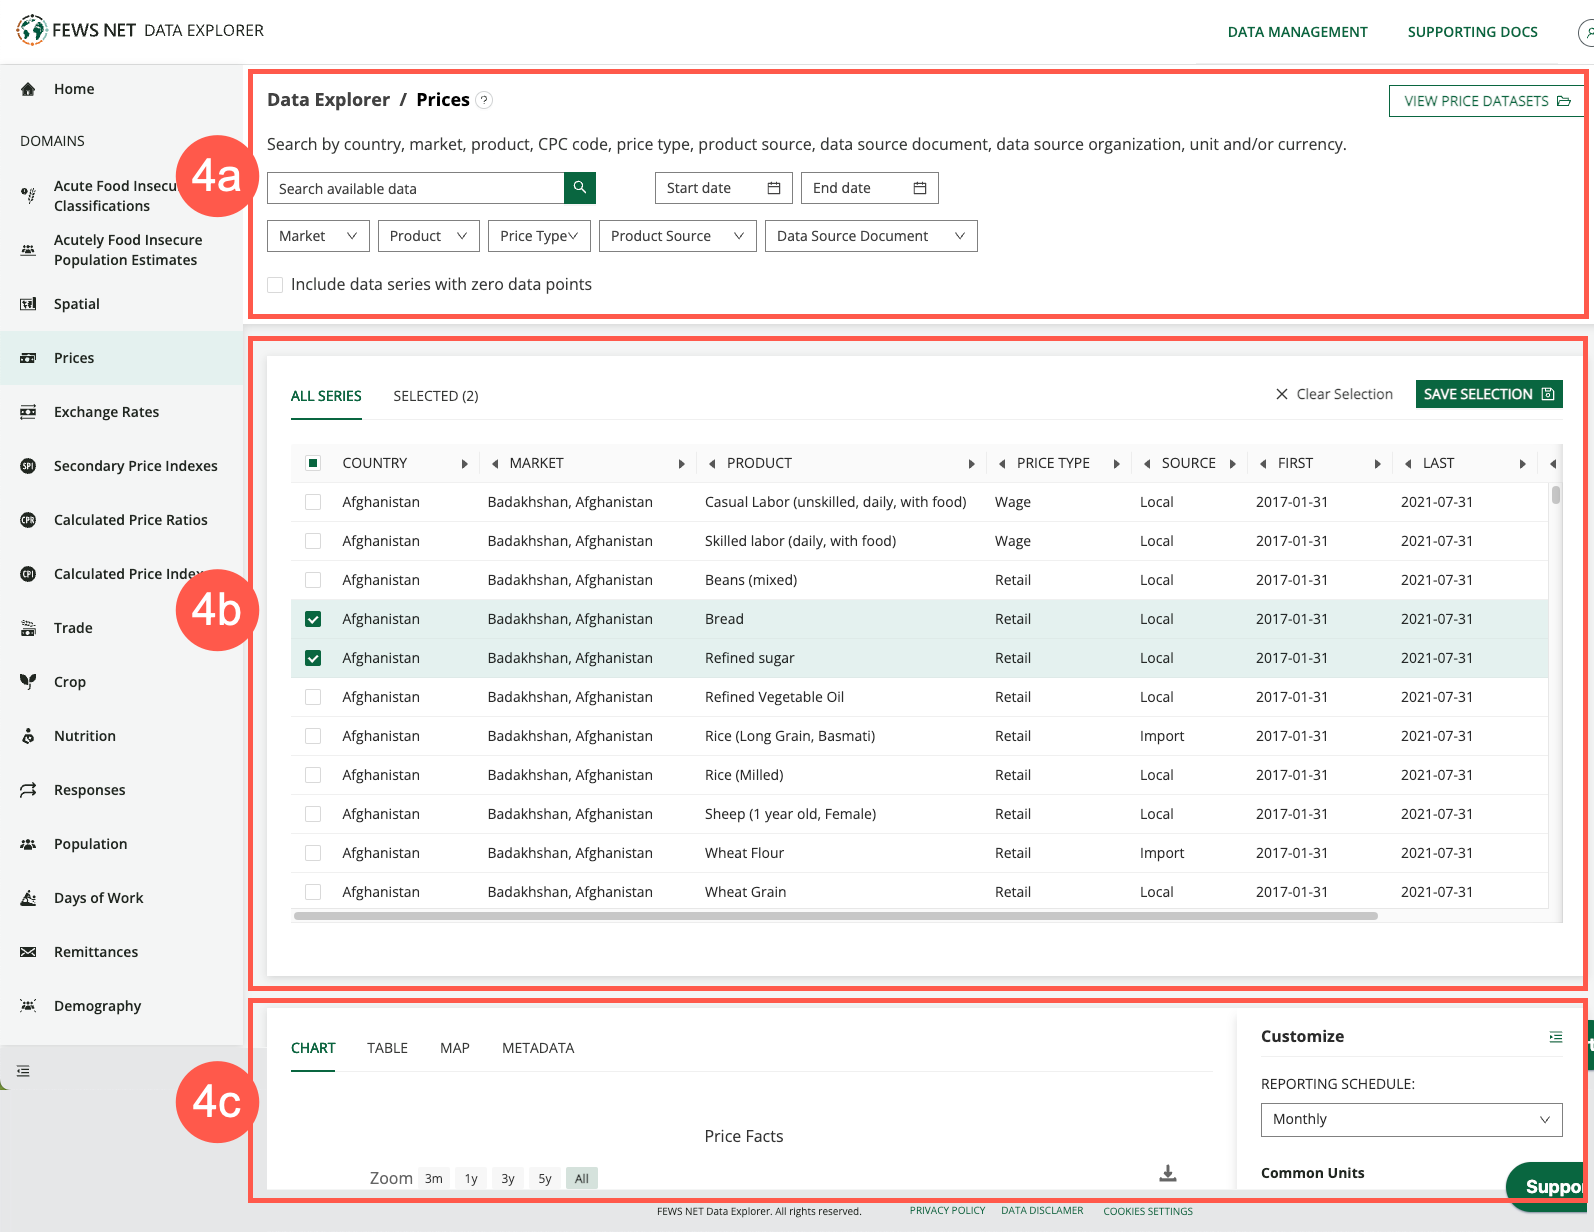
There are 4 parts to the Visualize and Export section of the Data Explorer:
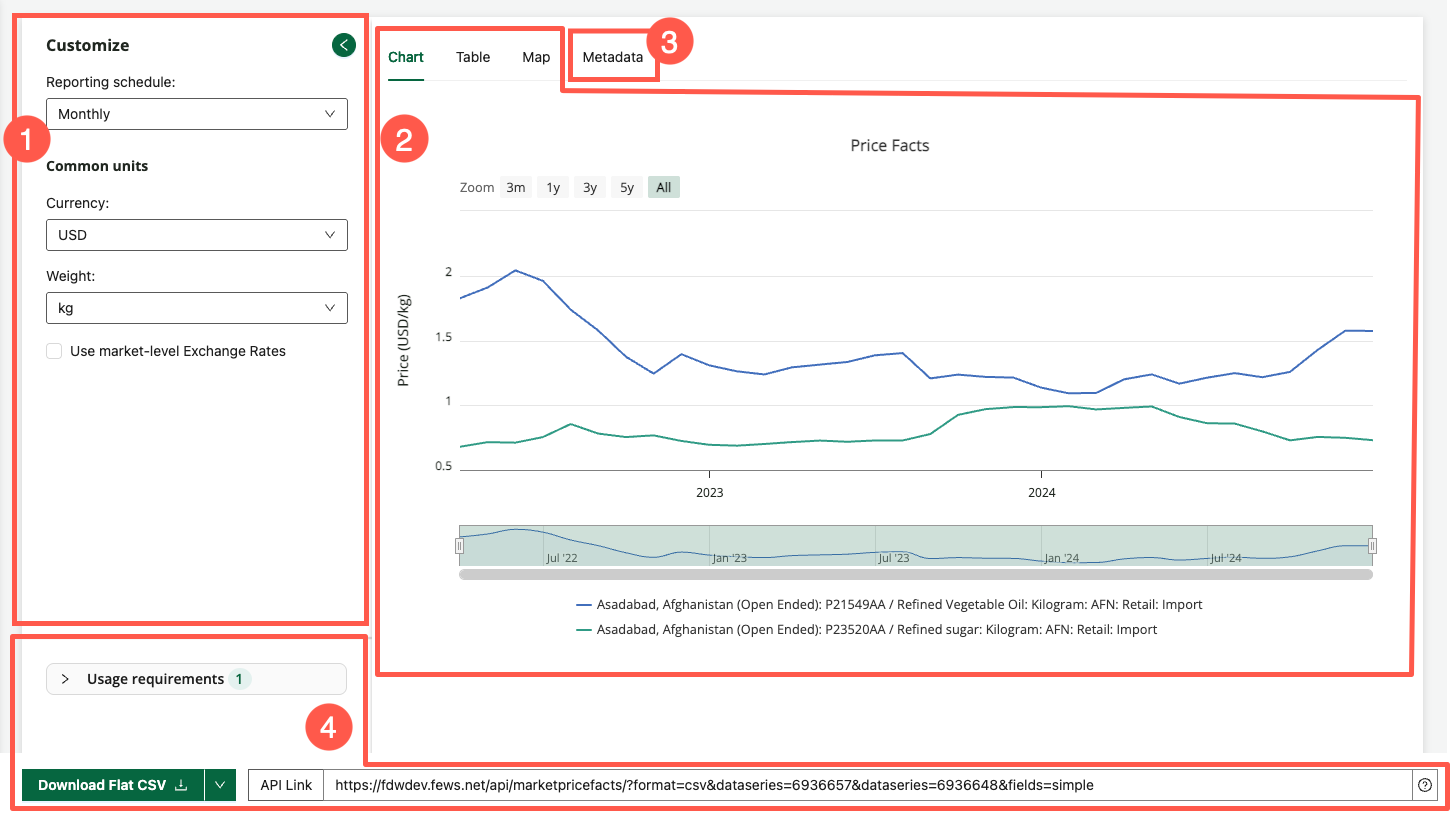
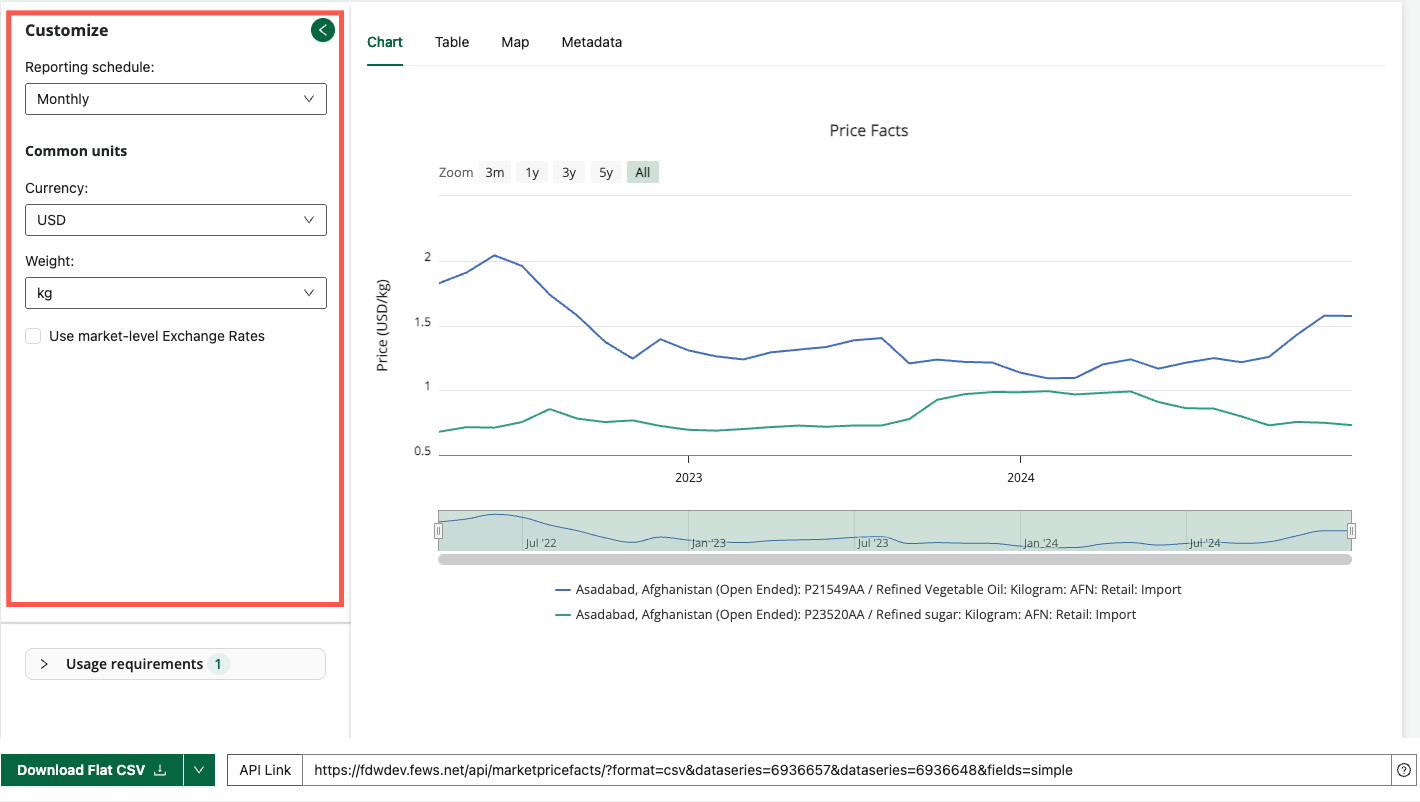
1. Customize your data view
Aggregation options are available for most domains using the Customize menu.
These options allow you to convert or aggregate system data into specified units or aggregation parameters. Common conversion types include, currency, units of measure for weight and volume, and time.
How to video: customize and download charts
Watch the video below to learn more about creating, customizing, and downloading charts.
https://www.youtube.com/watch?v=wNbvavAvMrM&list=PL_QD9ZK20-GWeKv8OrfEqy9prfqGBtW5w&index=8&pp=gAQBiAQB:2. Visualize data
The visualizations built into the FDE allow you to preview a dataset to ensure the data is relevant. You can make changes to your search, filter, data series selections, and/or customization options and quickly see how those changes affect your data. Once you are satisfied that you are capturing the data you want, you can then export the dataset.
Visualization | Domain Availability | Details |
|---|---|---|
Table | All Domains | Each row displays data on an individual data point within the selected dataseries. |
Chart |
| Each line represents a selected data series, with the horizontal axis being the timeline. The legend contains information that helps users identify each data series. |
Map |
| Maps show the geographic locations of the individual data points within the selected data series. Maps may include a time slider and other options to help visualize the change over time, and geographic coverage of boundaries. |
How to video: using charts and maps
Watch the video below to learn more about creating and interacting with charts and maps in FDE.
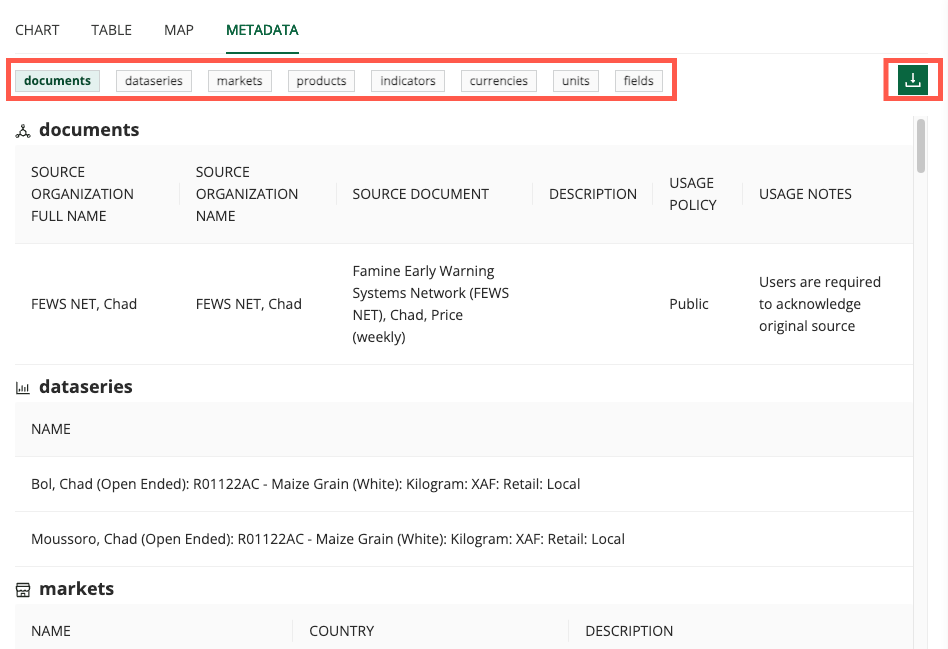
https://www.youtube.com/watch?v=kvJpCjSRvRM&list=PL_QD9ZK20-GWeKv8OrfEqy9prfqGBtW5w&index=7&pp=gAQBiAQB:3. Explore the Metadata
The Metadata tab contains detailed information about the metadata for the selected data series. You can scroll through the metadata or choose a heading to jump to that section. You can also download the metadata using the download button on this tab.
How to video: exploring the Metadata tab
Watch the video below for an example of accessing and downloading metadata information.
https://www.youtube.com/watch?v=Pfl3dY6ch1E&list=PL_QD9ZK20-GWeKv8OrfEqy9prfqGBtW5w&index=10&pp=gAQBiAQB:4. Export data
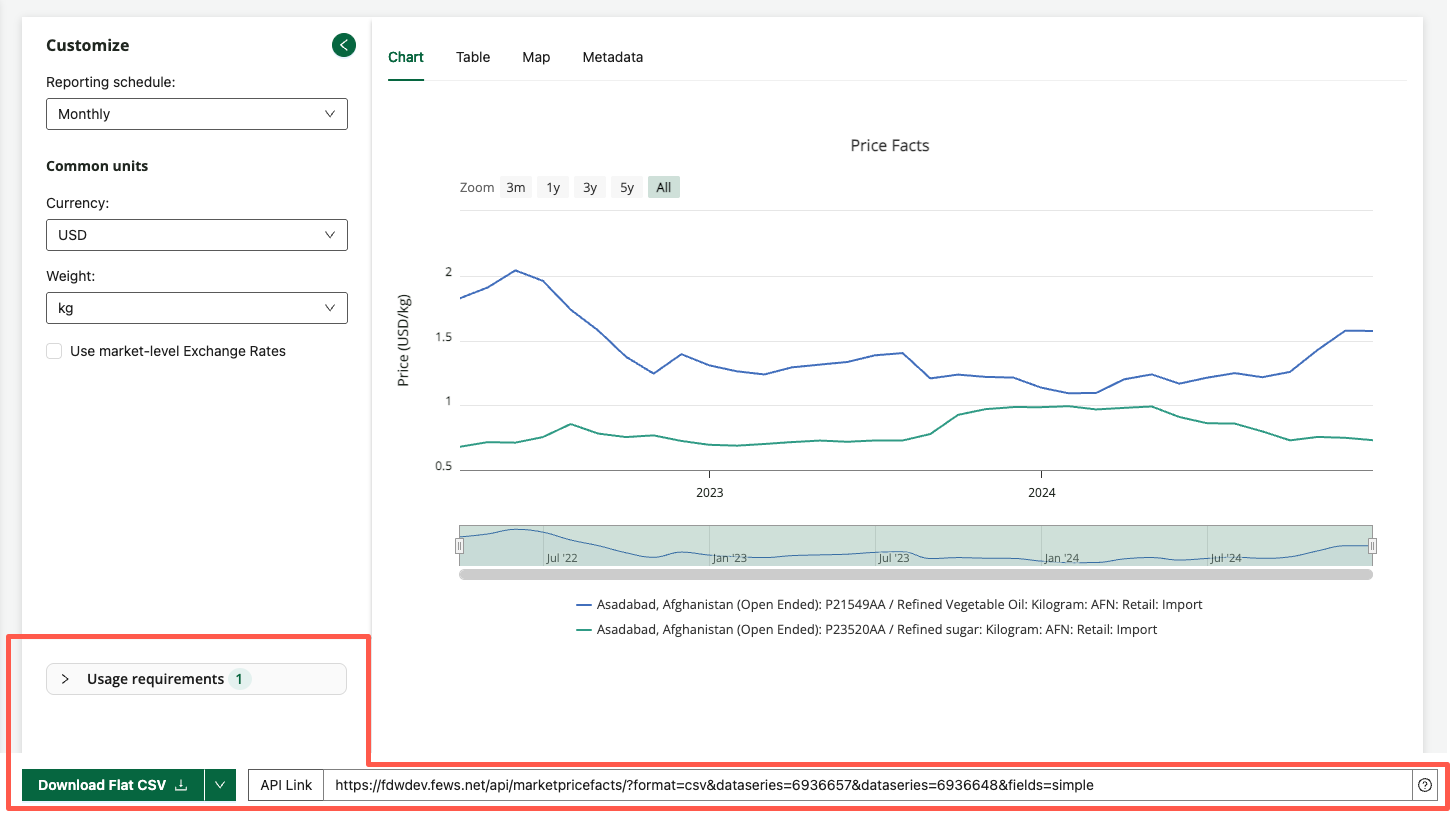
The first step to export data is to choose a file format by clicking the caret next to the Download button. The menu that appears will give domain-specific options that might include flat and time series CSV, HTML, JSON, GeoJSON, TopoJSON, and XML formats.
To request access to data in a file format not listed, complete the FDE User Feedback form.
You can open the Usage Requirements drawer to see information on the source document and usage requirement for the selected data.
You can then export data from any domain in the FDE in one of two ways:
Download: You can download a dataset directly to your device.
API Link: Refreshable links connect directly to the FEWS NET Data Warehouse database server, allowing Excel, your browser, or another application to automatically fetch the most recent data from the server whenever the links are accessed. The refreshable link can also be edited and used for calling the FEWS NET Data Warehouse API.
How to video: data extract options
Watch the video below to learn more about domain-specific options for customizing and exporting data.
https://www.youtube.com/watch?v=5z-e11EFDY0Definitions and Standards
Select one of the options below to learn more about common definitions and organization practices that compose the FEWS NET Data Explorer (FDE).
Abbreviations: Abbreviations used within the FEWS NET Data Platform
Domain categorization: Categorization of data types into domains
Glossary: Glossary of relevant FEWS NET and FDE terminology
Metadata standards: Metadata standardization guidelines used in FDE
Additional Resources
About our data: Learn more about the country context surrounding our data and data collection methodologies.
FEWS NET API: Information on FEWS NET’s comprehensive REST API.
Frequently asked questions: Answers to common questions about the FDE.
Recent updates: Learn about recent changes that affect your FDE experience.