Household Economy Analysis and Livelihoods
Household Economy Analysis (HEA) is a livelihoods-based analytical framework used to understand the specific economic actions (food production, sales, expenses) a household takes to survive. It assumes that understanding the normal household economy is essential to predicting how a crisis will impact livelihoods. This allows decision makers to plan interventions that will support, rather than undermine, existing survival strategies.
HEA is a systems-based approach. It aims to build a holistic picture of livelihoods. This means that each piece of information gathered has to make sense in relation to the rest.
HEA bridges the concepts of livelihoods and household economy:
-
Livelihoods are the broad, sustainable strategies of making a living among related groups of households. This can encompass social, cultural, and political factors (such as access to community services, power dynamics, and social status). Livelihood Strategies are specific ways in which these household groups use and combine their assets to obtain food, income, and other goods and services.
-
Household economy is the collection of economic, measurable components of a livelihood strategy. This includes the ways in which a “typical” household (that is, a hypothetical household representing a group of households) acquires its income, savings, and asset holdings, and by which it meets its food and non-food needs.
In HEA, a household is defined as a set of people who live together most of the time, contribute to a common economy, and share the food and other income from this. Or, according to WFP, a group of people who “eat from the same pot.” Individuals that are not part of a household can live together but not “eat from the same pot” as living under the same roof reduces per person rent, utilities, etc. even if the individuals are not otherwise sharing their income and other resources.
Livelihood Zones and Baselines
HEA groups households in two ways: geo-spatially into Livelihood Zones, and cross-sectionally into Wealth Groups.
-
The first part of the HEA process includes a livelihood zoning exercise that is conducted through interviews, workshops, and a secondary data review. Outputs of that exercise include a map of Livelihood Zones for the country, as well as the population of and a description for each zone. Livelihood Zones are geographical areas within which people share broadly the same patterns of access to food and income (that is, they grow the same crops, or keep the same types of livestock), and have similar access to markets. It represents the constraints that geography and market access place on options for making a living available to households in a given area.
-
Example: People living in a fertile highland area might pursue an agricultural pattern of livelihood while those living in a semi-arid lowland area may be either pastoralists or agro-pastoralists.
-
Example: Consider two zones in the same country with similar soil types, average rainfall, and wealth characteristics. In the East they grow predominantly millet due to greater drought frequency and in the West they grow predominantly sorghum. Millet and sorghum are similar but different crops with different vulnerability to water stress. Therefore, these areas are may be characterized as different livelihood zones.
-
-
Wealth Groups are groups of households within the same community who share similar capacities to exploit the different food and income options within a particular Livelihood Zone. Households are grouped together using local definitions of wealth and the quantification of their assets. The level of division depends on how the community view their society, and the purpose of the analysis.
These divisions are used to create livelihood Baselines. A Baseline is a quantified analysis of sources of food, income, and expenditure for households in all wealth groups in a single Livelihood Zone over a defined Reference year. A Reference year is a specific, recent 12-month period, that may or may not correlate to a calendar year, chosen to represent typical conditions in a livelihood zone.
A Livelihood Zone may have more than one Baseline associated with it, either updating information as things change over time or representing different parts of large livelihood zones. Baselines need to be updated when new crops, livestock, or expenditures arise, or after 10 years when the Integrated Food Security Phase Classification System considers the data to be invalid.
Baseline data is most commonly stored in Baseline Storage Sheets (BSS), spreadsheets which are the primary source of data for this platform. Analysts may use narrative profile reports, available on the FEWS NET website, to assist in interpreting baseline data.
Primary Livelihood Systems
The dominant patterns of livelihoods identified in the development of a Livelihood Zone map, for example pastoralism, fisheries, or irrigated cropping, are called Primary Livelihood Systems or production systems. Not all households within a livelihood zone will look the same from a livelihood or production standpoint, but one type of system is deemed predominant for each Livelihood Zone during the mapping phase.
Descriptions of the Primary Livelihood Systems found in LEX are available on the Overlays and Filters page.
According to the Practitioner’s Guide to HEA:
The system of production is determined by a range of factors, of which geography is clearly the most important. Other factors include the marketing system (e.g. demand for one product as compared to another, the experience and capital resources of traders), the financial and banking system (e.g. availability and affordability of credit) and government policy (e.g. development policy, pricing policy, policy on the provision of production inputs, etc.). It is quite possible for two livelihood zones to be similar geographically and agroclimatologically, but for one to be based, for example, upon food and livestock production, while another is given over to the production of sugarcane because agro-ecological conditions are favourable, farmers in the zone are encouraged to grow the crop, there is a processing factory nearby and there are good roads/railways to transport the final product to market.
See the glossary for more definitions.
Livelihood Strategies and Activities
A Livelihood Strategy is one of a set of options used by households in a Livelihood Zone to obtain food and cash income and acquire the items needed to live. They are categorized by type for ease of comparison. Livelihood Strategy Types include things like milk production, crop production, food purchase, relief aid, and wild food gathering. See a full list.
Each Livelihood Zone has a set of possible Livelihood Strategies. When one of those Strategies is used by a specific Wealth Group in the Livelihood Zone, it is a Livelihood Activity.
Example
Livelihood Strategy Type: Food Purchase
Livelihood Strategy: The purchase of husked rice in Livelihood Zone HT02 (2014)
Livelihood Activity: The amount of husked rice purchased by the very poor Wealth Group in Livelihood Zone HT02 (2014)
Survival and Livelihood Protection Thresholds
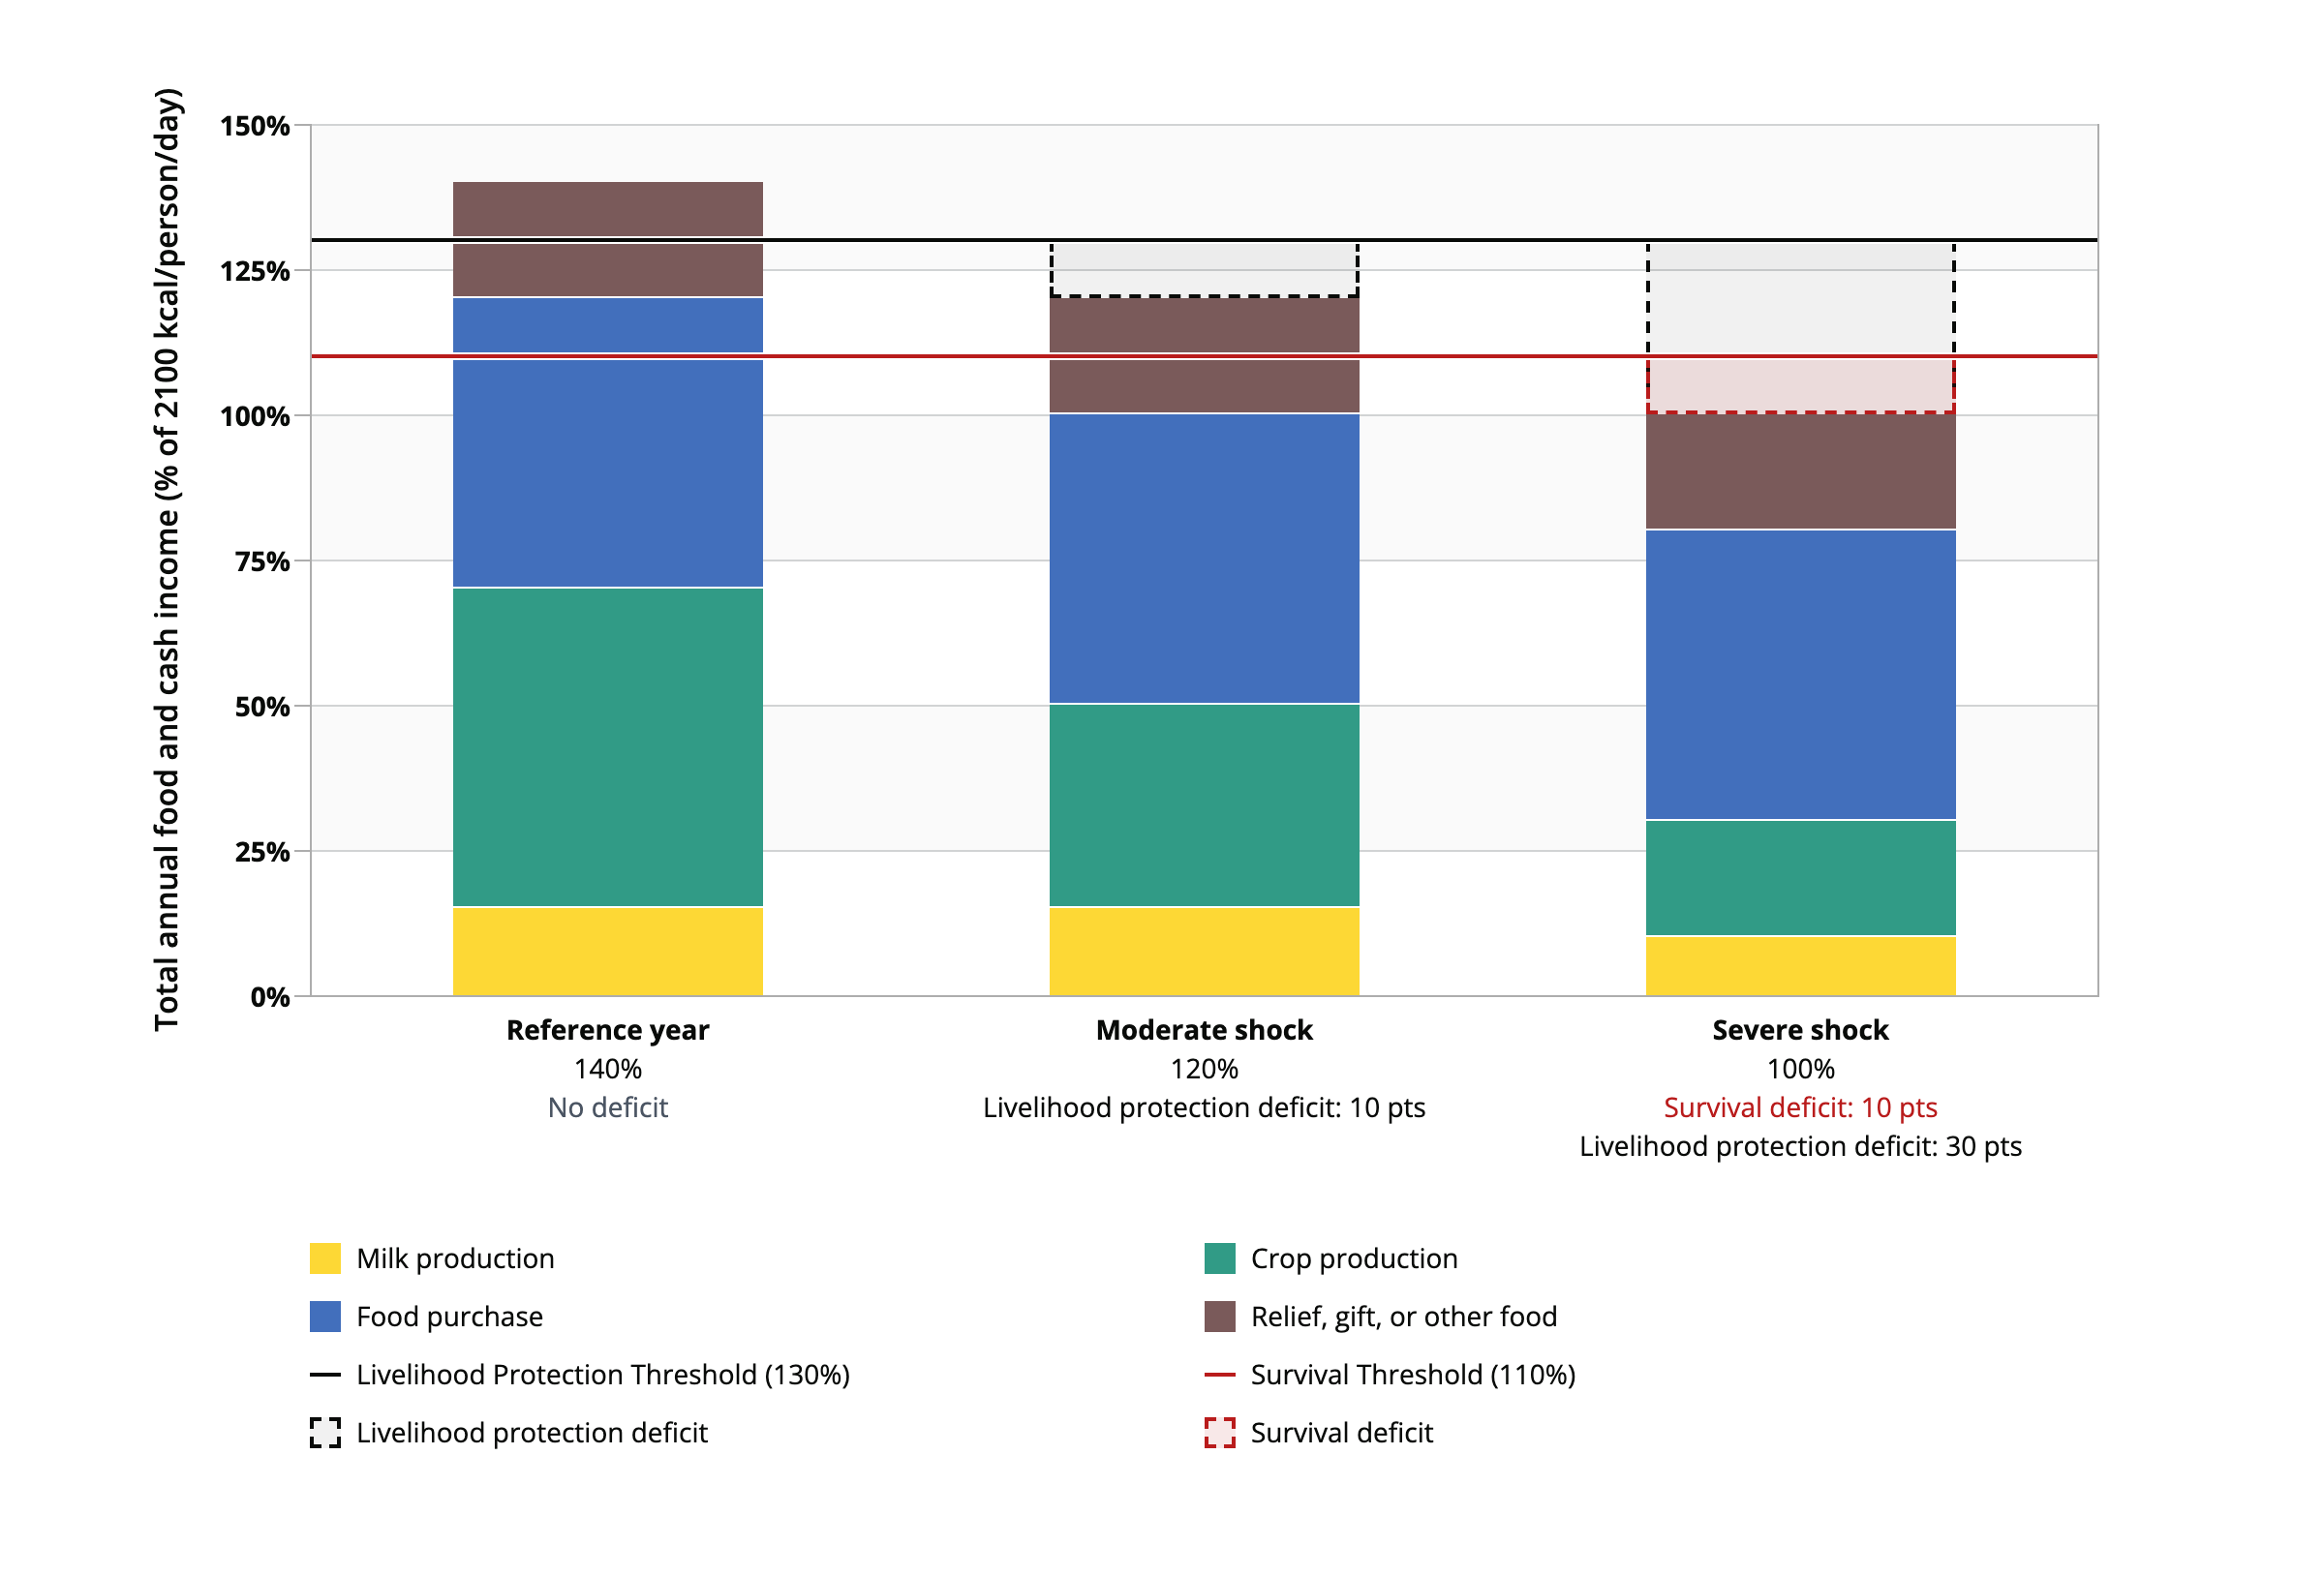
The Survival Threshold and Livelihood Protection Thresholds represent the income required for households in a Wealth Group to survive and sustain their livelihoods, respectively. The Survival Threshold is the line below which intervention is required to save lives. The Livelihood Protection Threshold is the line below which an intervention is required in order to maintain existing livelihood assets and strategies. These thresholds are included in Livelihoods Explorer (LEX) graphs so they can be compared to total income (food + cash). This can provide information about the magnitude of a required response and what kind of response might be most appropriate.
The Survival Threshold is the total food and cash income required to cover the food and non-food items necessary for survival in the short term. It includes:
-
100% of minimum food energy needs (calculated as 2100 calories/person/day, see below)
-
The costs associated with food preparation and consumption
-
Where applicable, the cost of water for human consumption
The Survival Threshold is the line below which intervention is required to save lives.
The Livelihood Protection Threshold is the total income required to sustain local livelihoods. It includes:
-
All items covered in the Survival Threshold
-
Access to basic services, like health care
-
Items needed to sustain livelihoods in the medium to longer term, like seeds
-
Items needed to achieve a minimum locally acceptable standard of living, like basic clothing or tea
The Livelihood Protection Threshold is the line below which an intervention is required in order to maintain existing livelihood assets and strategies.
Learn more about how the Thresholds are calculated.
2100 kilocalories
The Livelihoods Explorer uses 2100 kilocalories (kcals) per day per person as the standard for minimum food energy needs in line with the internationally accepted minimum requirement. Both food and income sources are converted into kilocalories allowing for easy comparison.
Both Survival and Livelihood Protection Thresholds will be greater than 100% of 2100 kcals/person/day since they include non-food essentials.
This practice is in line with guidance from the Practitioner’s Guide to HEA:
All food and income sources have been converted into their calorific equivalencies, i.e. the calories in food consumed, plus the calories that could hypothetically be purchased if all cash income was used to buy grain, and then compared to the internationally accepted standard of 2100 kilocalories per person per day. This has the advantage of allowing for like-to-like comparisons, and also of ensuring that a rigorous cross-checking can take place. In most instances, HEA uses the measure of 2100 kilocalories rather than a more sophisticated nutritional measure (such as the ideal dietary composition) because this meets the immediate requirements of the decision makers who tend to demand HEA information, and it fits within the practical limitations of most assessments. This is not to say that energy alone is a sufficient measure of nutritional adequacy; but it is the first measure of whether or not people will starve. Further analysis along nutritional lines is possible with HEA, although targeted nutritional survey work is likely to be more appropriate for gaining specific pieces of nutritional information.