Within the Livelihoods Explorer, some percentages are calculated using 2100 kcals/person/day (% kcal pppd) as the denominator and some are calculated using total calories consumed as a percent of 2100 kcal pppd as the denominator. The difference is that 2100 kcals pppd is always 100% of the daily caloric need, whereas the actual total calories a household group may consume daily on average may be more or less than this.
These values have different purposes:
-
Comparing a strategy or activity on the basis of the share of total calories consumed is a simple and immediately intuitive way to understand its relative importance across Wealth Groups or zones.
-
Because the total number of kilocalories pppd consumed varies across Wealth Groups, using a common absolute for the denominator (2100 kcals pppd) rather than relative unit preserves differences in actual intake. It is useful for comparing contributions to needs relative to the same requirement.
When a percentage uses 2100 kcals pppd as the denominator, it will be explicit in the chart title, axis, and/or other label(s). These percentages are used in the Food and Food + Cash graphs in the Quick view and Detail view.
Example: Food graph
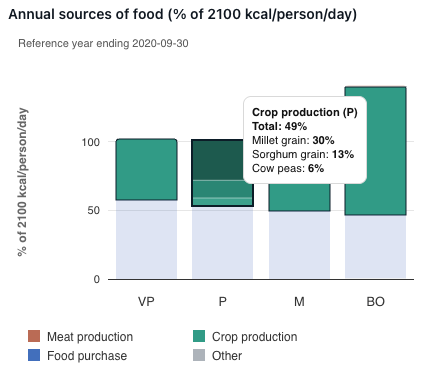
This graph shows the breakdown of how each Wealth Group in this Livelihood Zone acquired their food in the Reference year.
In this example, 49% of the kcals pppd for the Poor Wealth Group came from households growing their own crops. This is calculated as follows:
kcals pppd consumed from all crops grown by the household ÷ 2100 kcals pppd
Example: Food + Cash graph
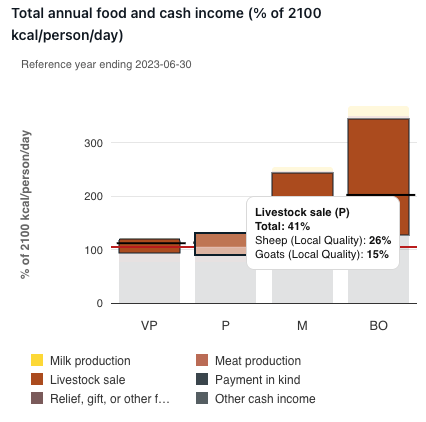
This graph shows the breakdown of how each Wealth Group in this Livelihood Zone acquired their food and cash income in the Reference year.
In this example, 41% of food + cash for the Poor Wealth Group comes from Livestock sales. This is calculated as follows:
The number of calories that can be purchased with the income from the sale of livestock ÷ 2100 kcals pppd
This equation uses total kcals that can be purchased from a specific amount of income which is calculated using the Baseline’s annual kcals cost.
Baseline annual kcal cost = (Cost of the "Other survival food" basket + Cost of providing the remainder of 2100 kcals for the Poor Wealth Group by purchasing the main staple) ÷ Average household size of the Poor Wealth Group
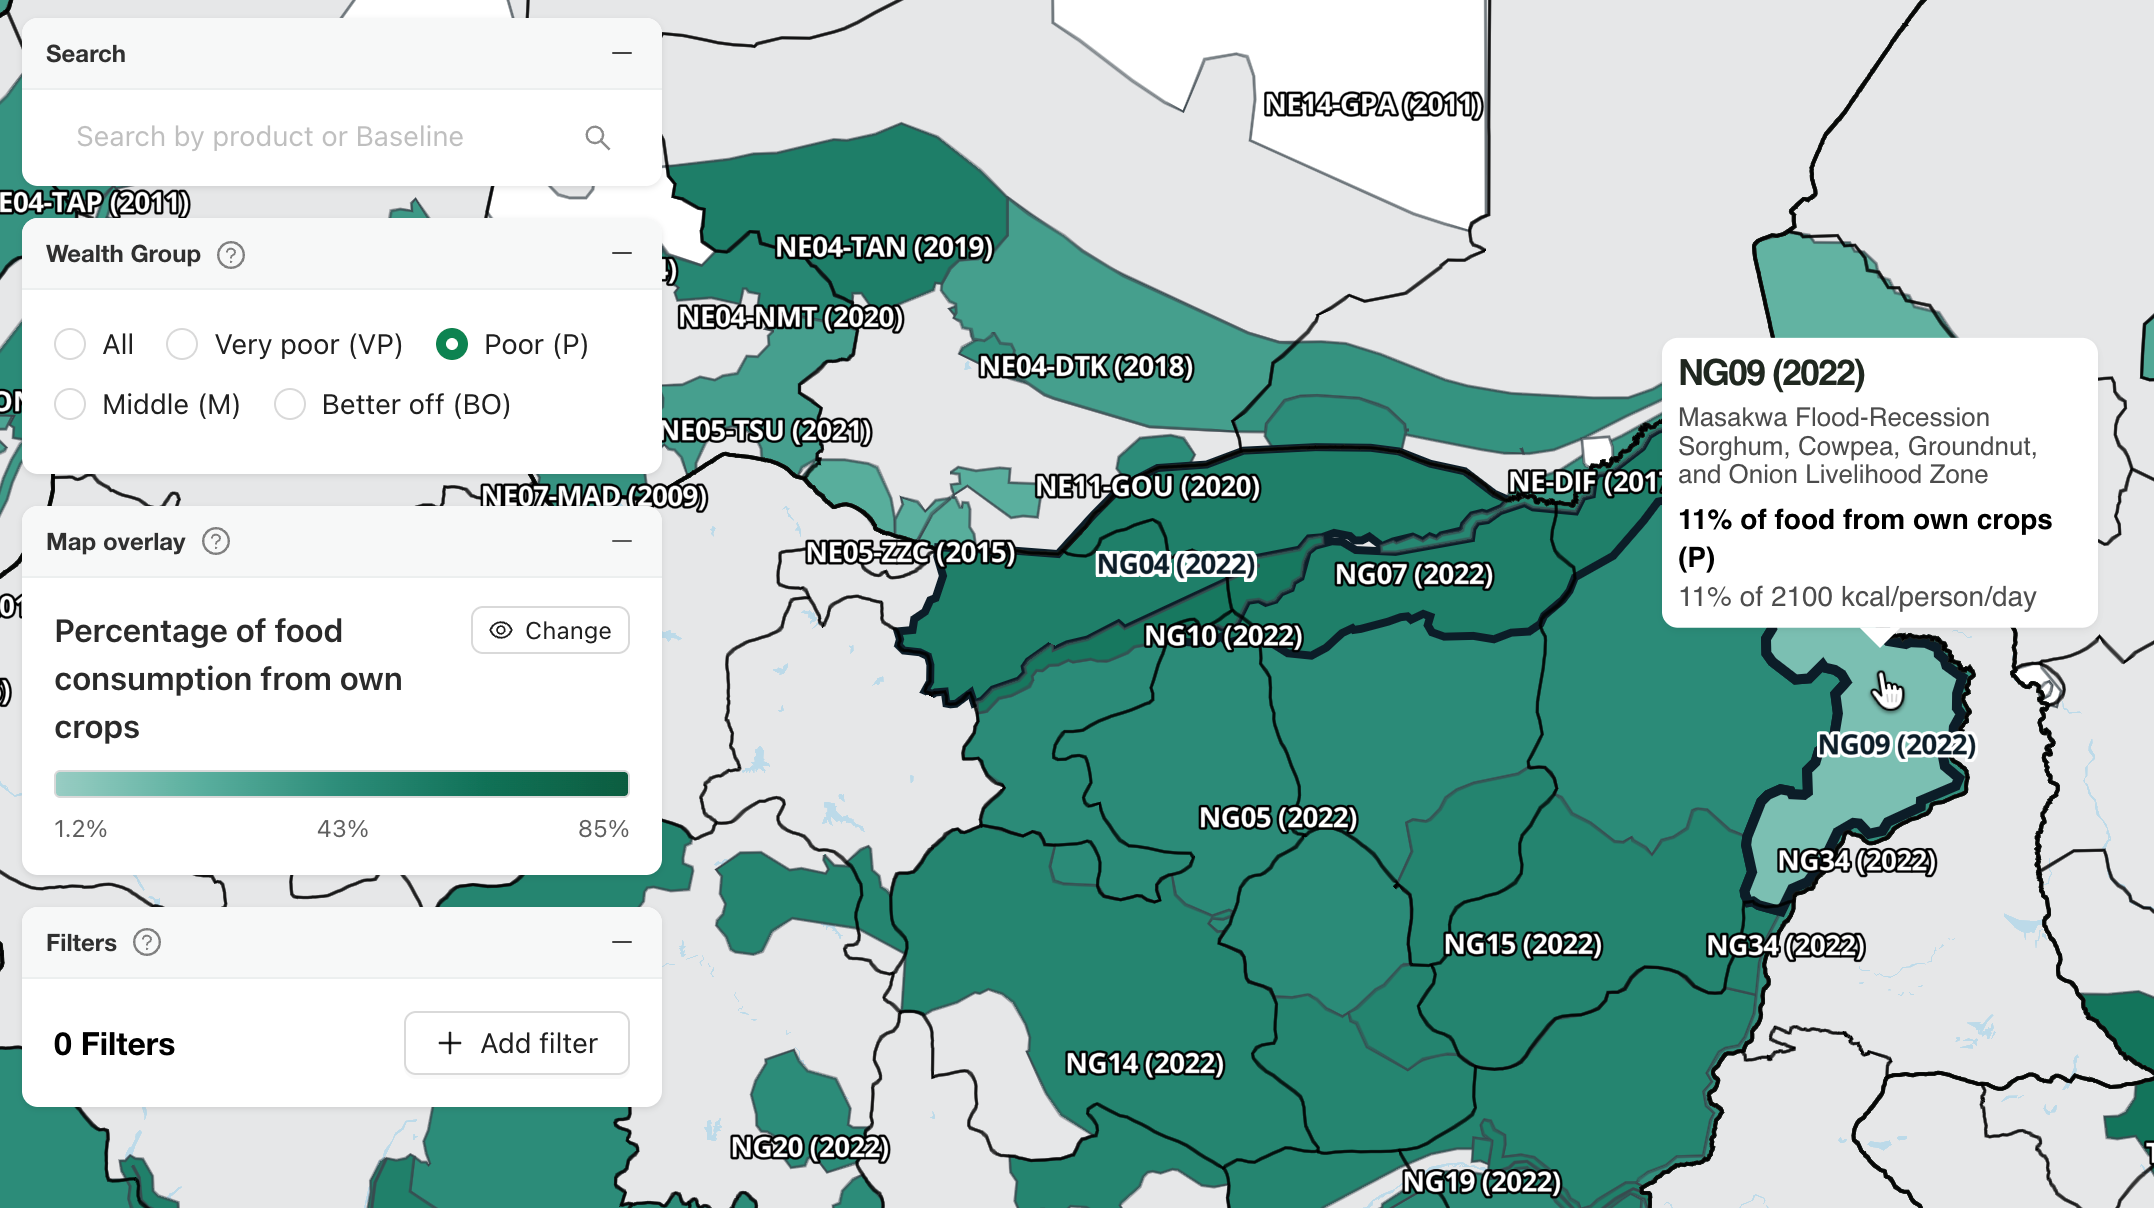
When using the “Percentage of food” overlays available in the Search tab, there are two percentages offered, the first for which the denominator is total calories actually consumed by households in a Wealth Group(s), and the second for which the denominator is 2100 kcal pppd.
Example: The differences in NG04
When looking at the Percentage of food consumption from own crops for NG04 (2022), you can see that the percentages vary slightly when looking at the overlay versus looking at the Food graph in the Detail view.
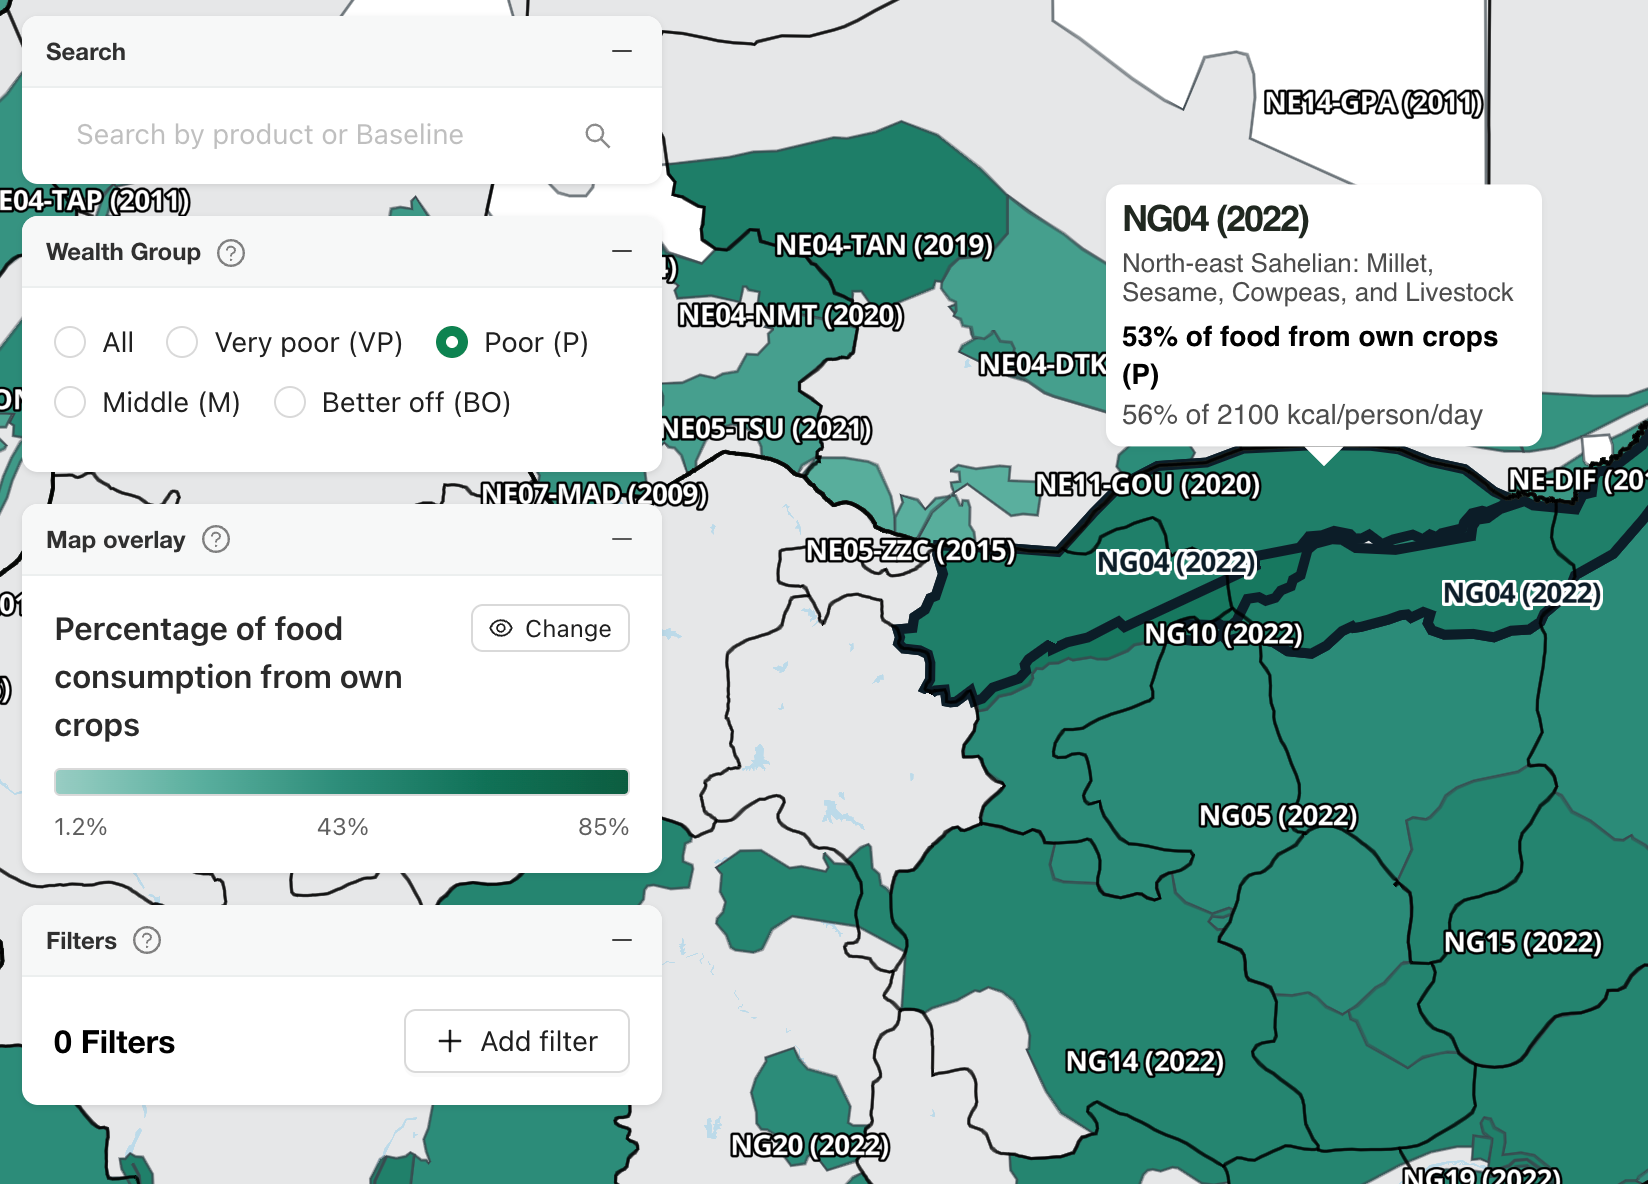
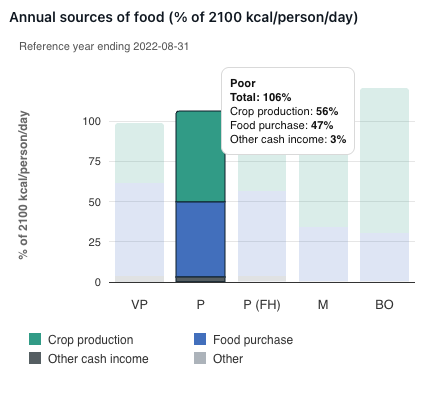
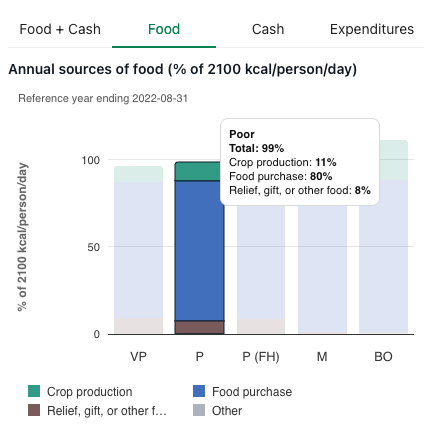
The Food graph is looking at a percentage of 2100 kcals/person/day. This matches the second percentage in the overlay.
The first entry in the overlay is looking at a percentage of actual calories consumed. The first percentage in the overlay is calculated as:
kcals pppd consumed from all crops grown by the household ÷ Total kcals consumed pppd
which can be checked against the numbers from the Food graph:
(kcals pppd consumed from all crops grown by the household ÷ 2100 kcals pppd = 56%) ÷ (total kcals consumed pppd ÷ 2100 kcals pppd = 106%) = 53%
In some instances, when a Wealth Group is consuming exactly, or close to, 2100 kcals/person/day, the percentages on the Food graph and the “Percentage of food” overlays will be the same.
Example: Percentages are the same
In NG09 (2022) the percentage in the Percentage of food consumption from own crops overlay and the Food graph are the same for the Poor Wealth Group because they are consuming close to 2100 kcals/person/day, and percentages are rounded to the nearest whole number.