Visualize and Export Data
There are 4 parts to the Visualize and Export section of the Data Explorer:
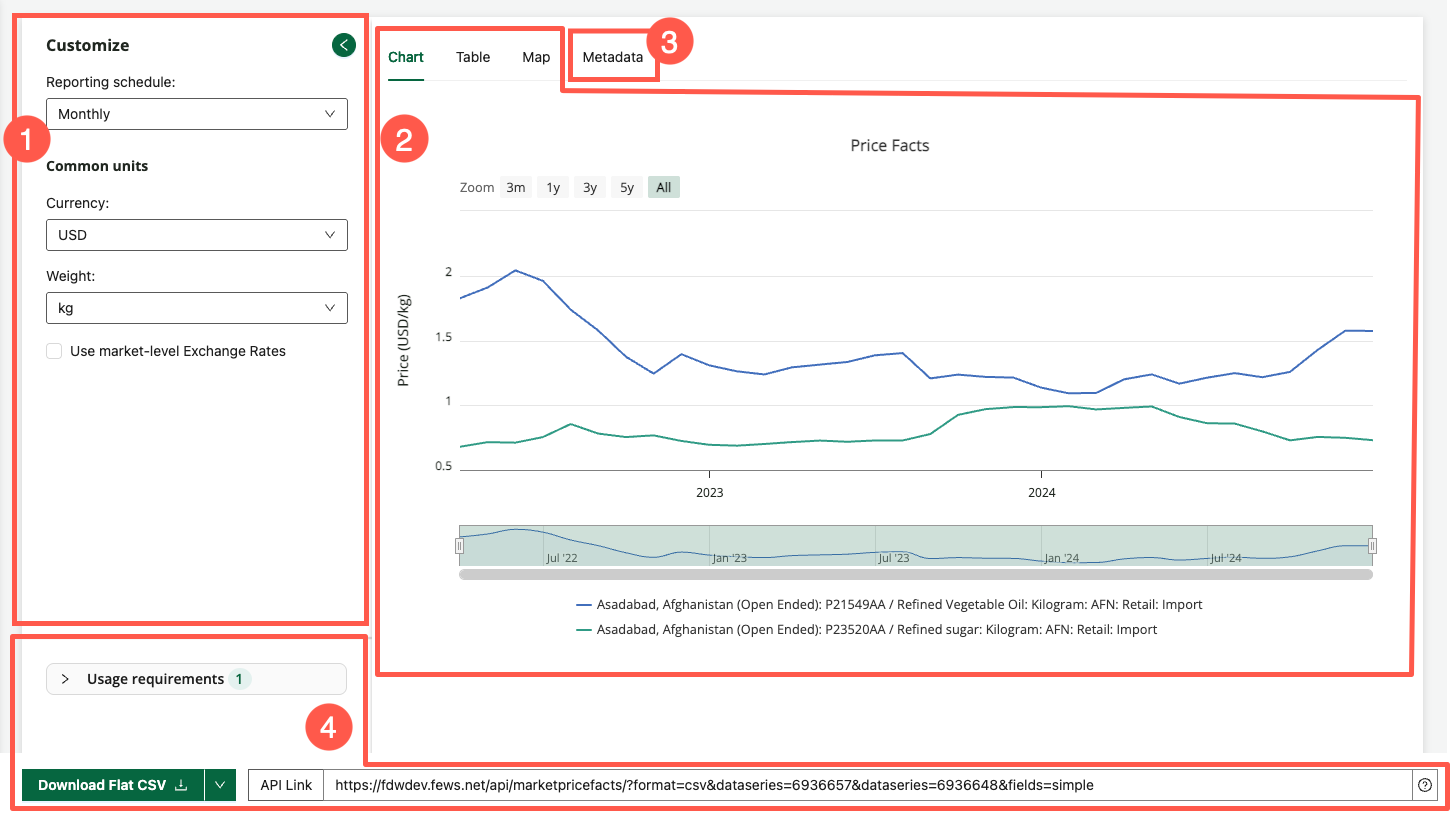
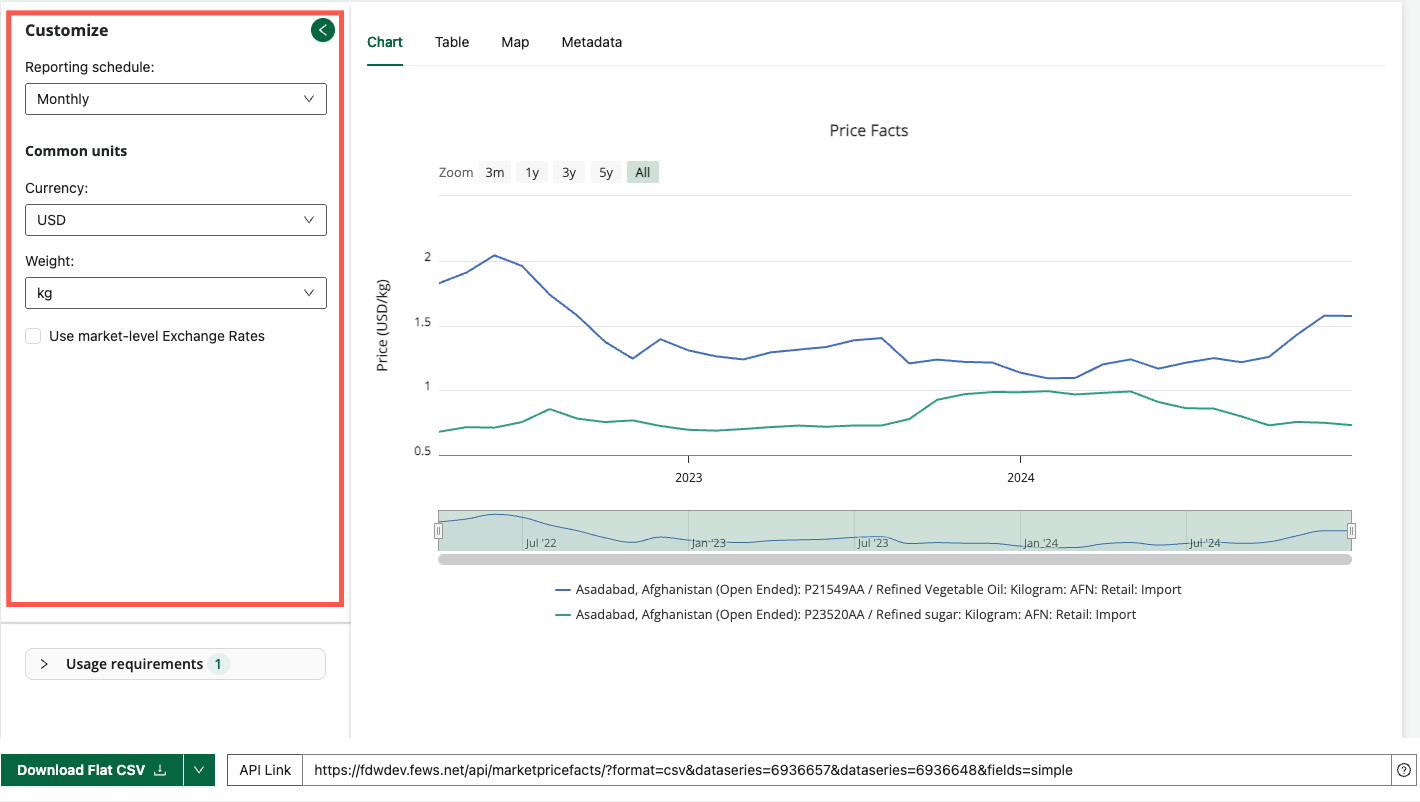
1. Customize your data view
Aggregation options are available for most domains using the Customize menu.
These options allow you to convert or aggregate system data into specified units or aggregation parameters. Common conversion types include, currency, units of measure for weight and volume, and time.
How to video: customize and download charts
Watch the video below to learn more about creating, customizing, and downloading charts.
https://www.youtube.com/watch?v=wNbvavAvMrM&list=PL_QD9ZK20-GWeKv8OrfEqy9prfqGBtW5w&index=8&pp=gAQBiAQB:2. Visualize data
The visualizations built into the FDE allow you to preview a dataset to ensure the data is relevant. You can make changes to your search, filter, data series selections, and/or customization options and quickly see how those changes affect your data. Once you are satisfied that you are capturing the data you want, you can then export the dataset.
Visualization | Domain Availability | Details |
|---|---|---|
Table | All Domains | Each row displays data on an individual data point within the selected dataseries. |
Chart |
| Each line represents a selected data series, with the horizontal axis being the timeline. The legend contains information that helps users identify each data series. |
Map |
| Maps show the geographic locations of the individual data points within the selected data series. Maps may include a time slider and other options to help visualize the change over time, and geographic coverage of boundaries. |
How to video: using charts and maps
Watch the video below to learn more about creating and interacting with charts and maps in FDE.
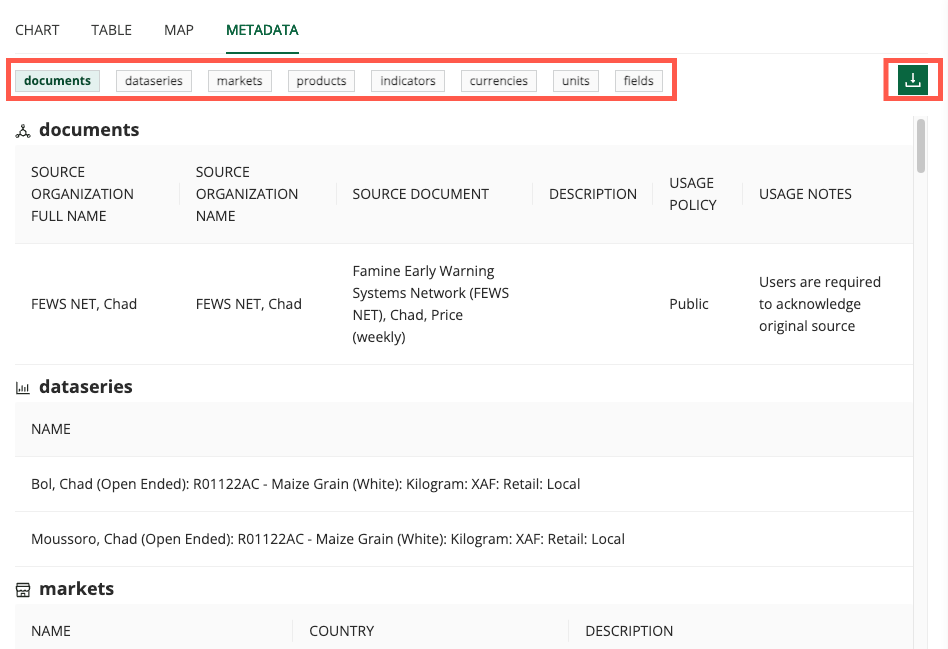
https://www.youtube.com/watch?v=kvJpCjSRvRM&list=PL_QD9ZK20-GWeKv8OrfEqy9prfqGBtW5w&index=7&pp=gAQBiAQB:3. Explore the Metadata
The Metadata tab contains detailed information about the metadata for the selected data series. You can scroll through the metadata or choose a heading to jump to that section. You can also download the metadata using the download button on this tab.
How to video: exploring the Metadata tab
Watch the video below for an example of accessing and downloading metadata information.
https://www.youtube.com/watch?v=Pfl3dY6ch1E&list=PL_QD9ZK20-GWeKv8OrfEqy9prfqGBtW5w&index=10&pp=gAQBiAQB:4. Export data
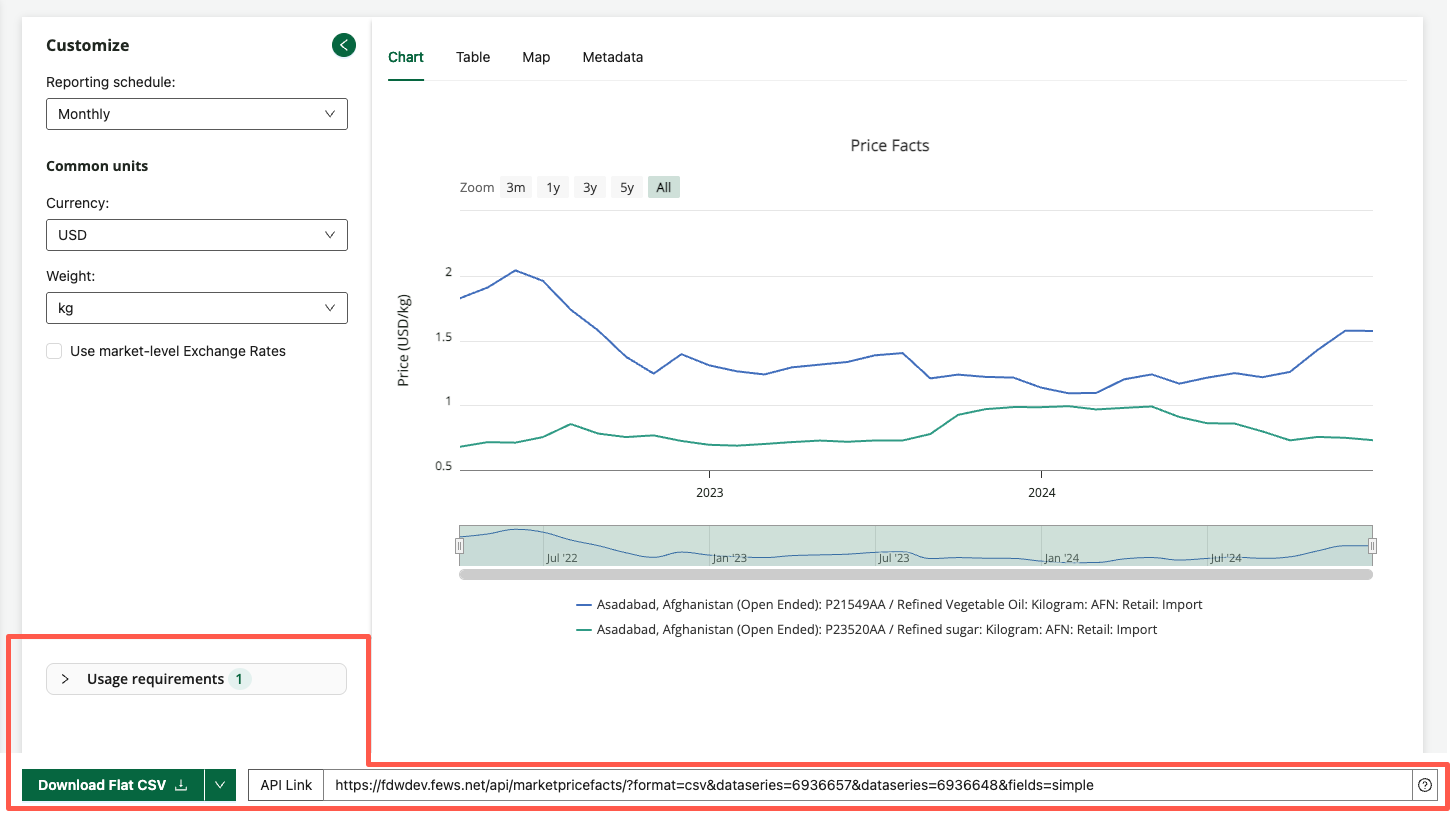
The first step to export data is to choose a file format by clicking the caret next to the Download button. The menu that appears will give domain-specific options that might include flat and time series CSV, HTML, JSON, GeoJSON, TopoJSON, and XML formats.
To request access to data in a file format not listed, complete the FDE User Feedback form.
You can open the Usage Requirements drawer to see information on the source document and usage requirement for the selected data.
You can then export data from any domain in the FDE in one of two ways:
Download: You can download a dataset directly to your device.
API Link: Refreshable links connect directly to the FEWS NET Data Warehouse database server, allowing Excel, your browser, or another application to automatically fetch the most recent data from the server whenever the links are accessed. The refreshable link can also be edited and used for calling the FEWS NET Data Warehouse API.
How to video: data extract options
Watch the video below to learn more about domain-specific options for customizing and exporting data.
https://www.youtube.com/watch?v=5z-e11EFDY0